Platform Walkthrough
A click-through of the Tumult platform: sign in, register an experiment, run it behind an approval quorum, e-stop a gated run, and generate the compliance evidence pack. Every screenshot below is the embedded web UI on the seeded demo stack — nothing is mocked.
Start the demo stack
docker compose -f docker/docker-compose.kronika.yml up -d --build
# open http://localhost:14318/ — demo credentials are in the compose file
The stack builds the UI and the tumultd binary, seeds an eight-experiment demo suite (run for real over OTLP), three manual-evidence records in different lifecycle states, and two demo identities: an admin and bob, an approver.
Sign in
Sessions are 256-bit opaque cookies (HttpOnly, SameSite=Strict, 12h); automation uses revocable kro_-prefixed tokens instead. Authorization is a single route table with viewer < operator < approver < admin roles — unmatched routes fail closed.
The seeded posture
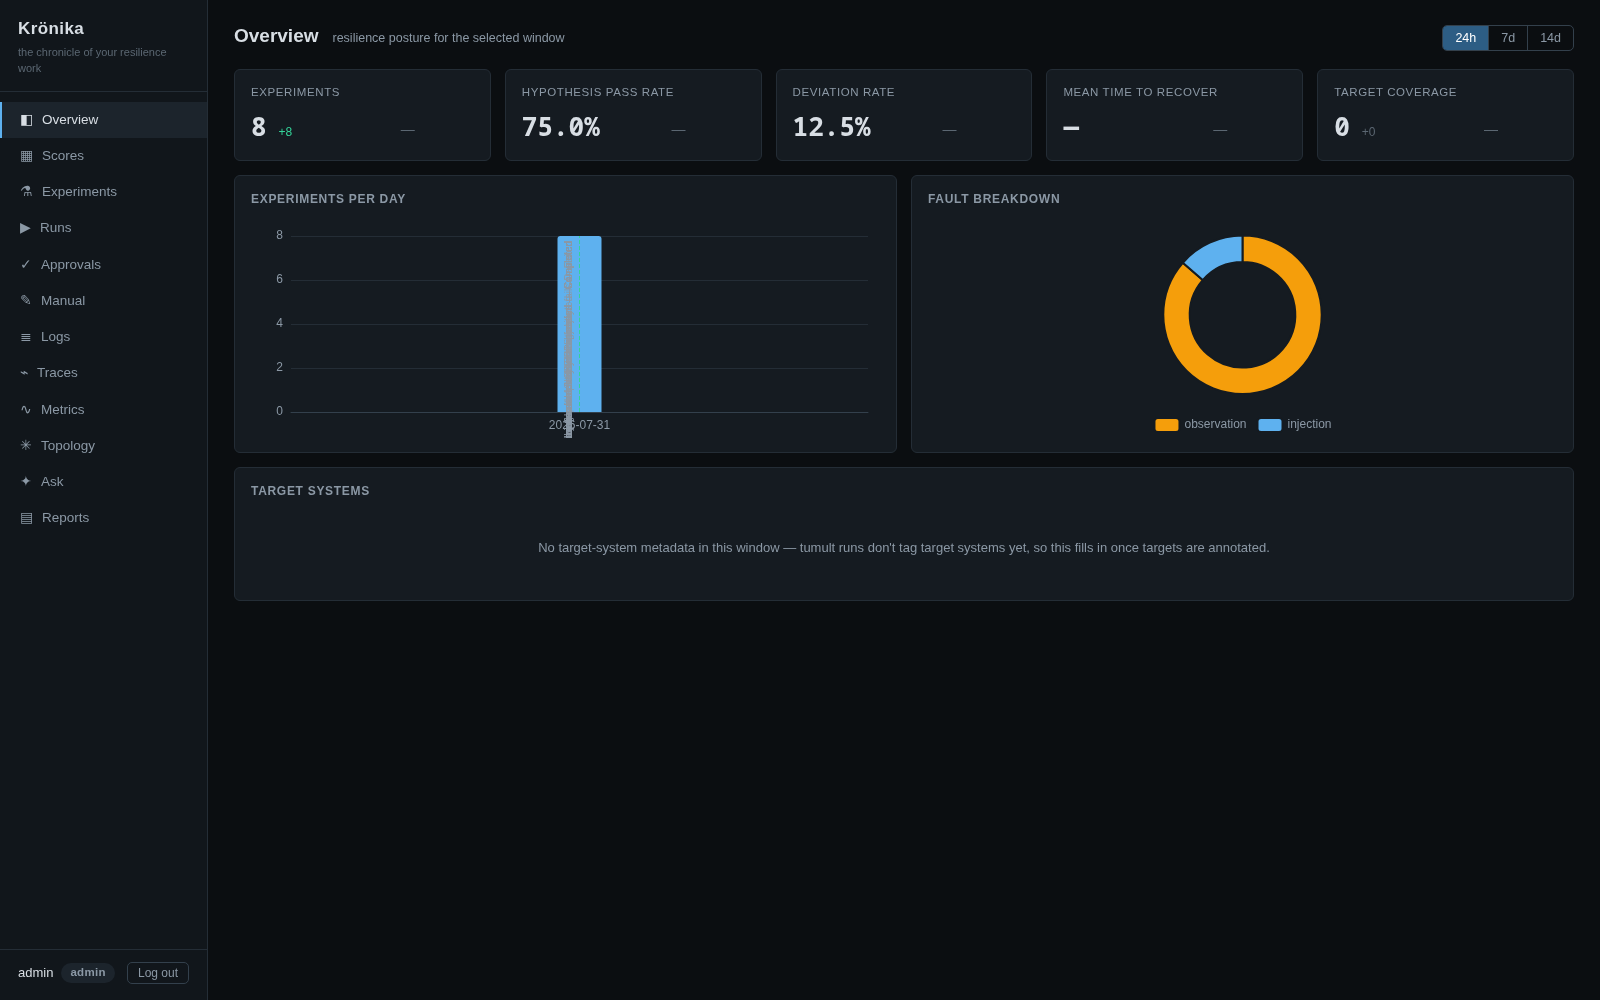
The overview answers “how are we doing” from the store, not from opinion: hypothesis pass rate, deviation rate, experiments per day, and the fault breakdown over the selected window.
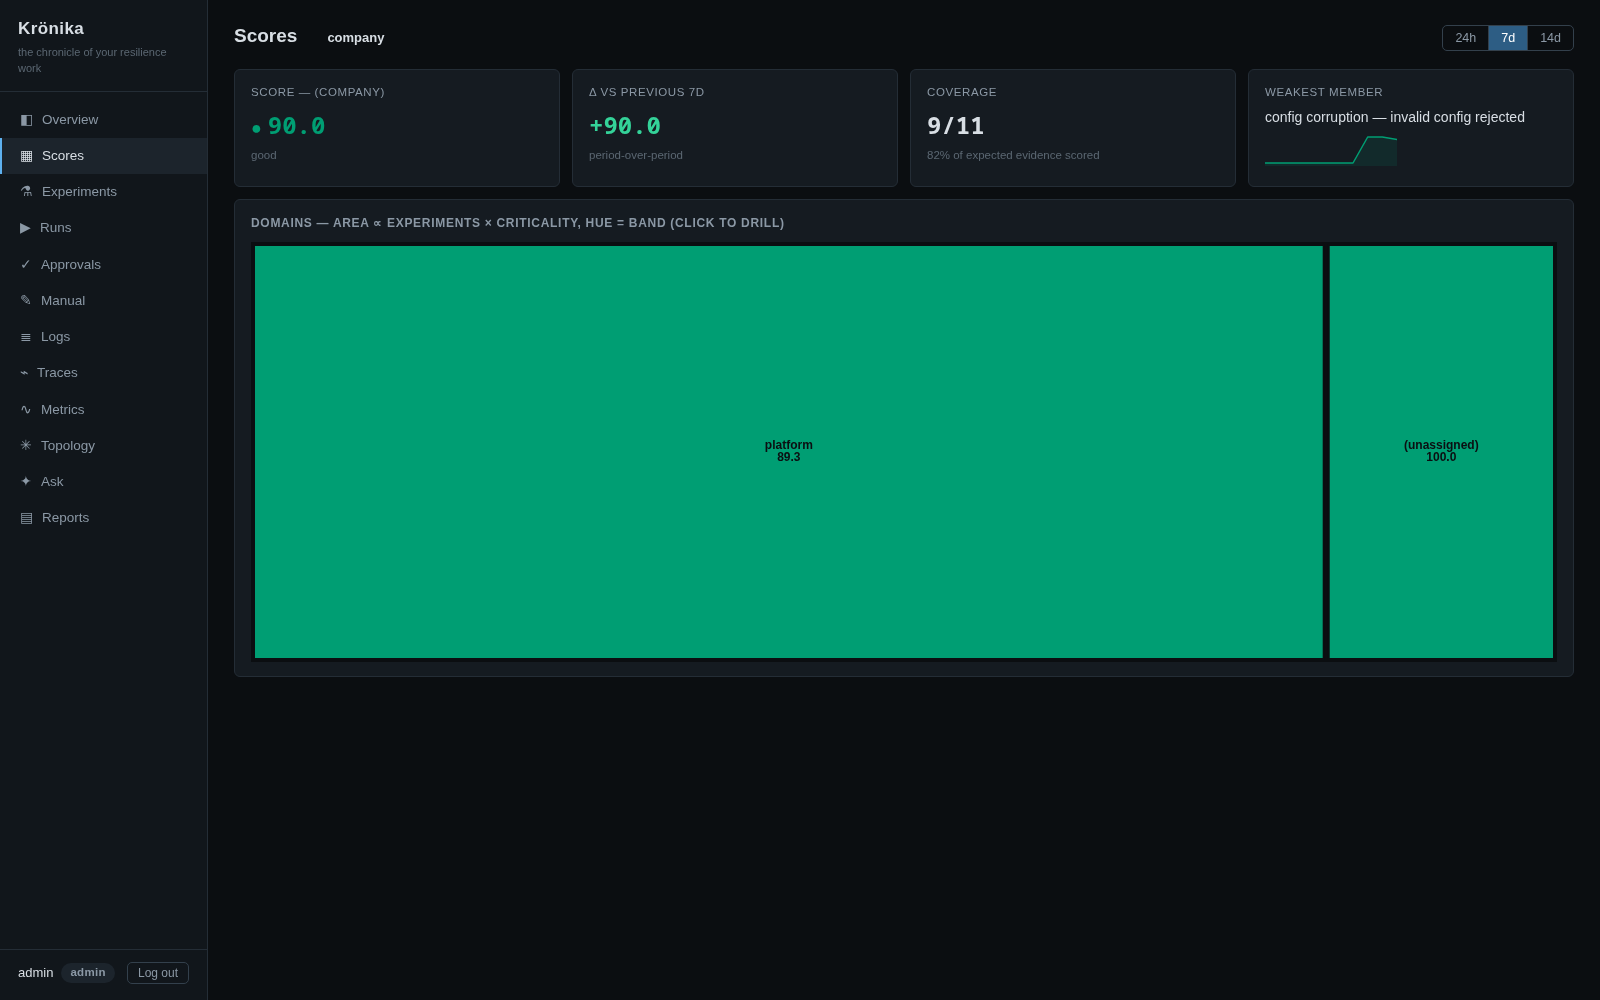
Scores roll per-experiment results up by org domain to the company root, with coverage against expected evidence and the weakest member called out. The treemap drills from company to domain to member.
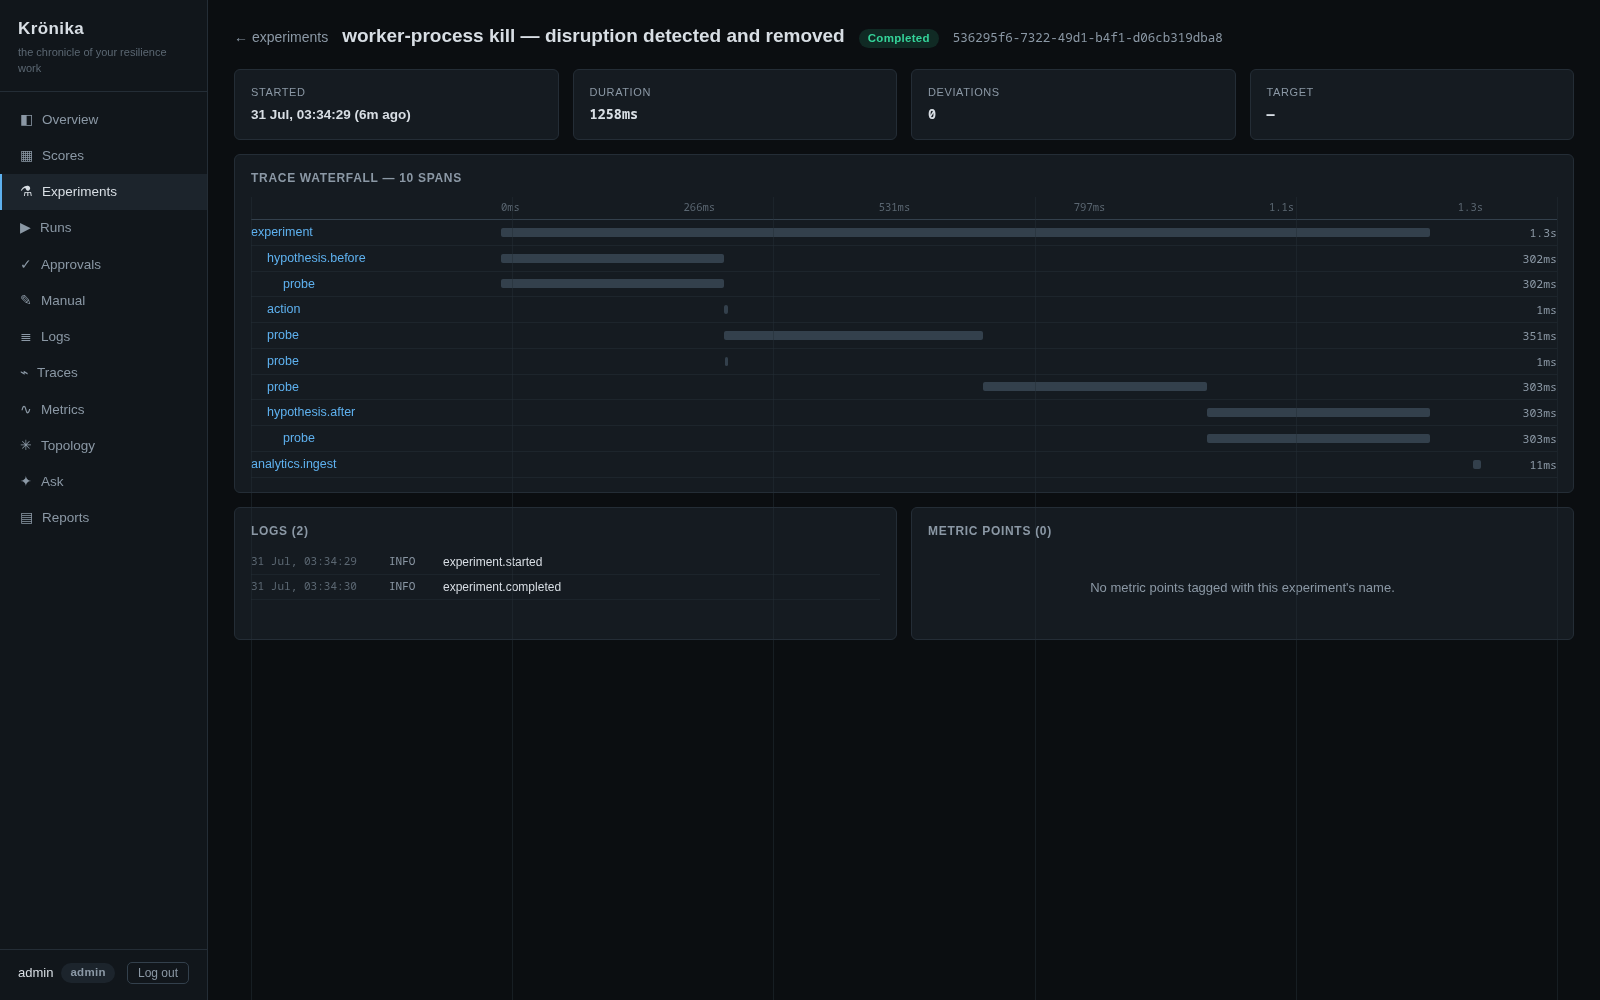
Every experiment keeps its full trace — hypothesis probes, the fault action, steady-state checks, and the analytics ingest — as a waterfall built from the OTLP spans the engine emitted.
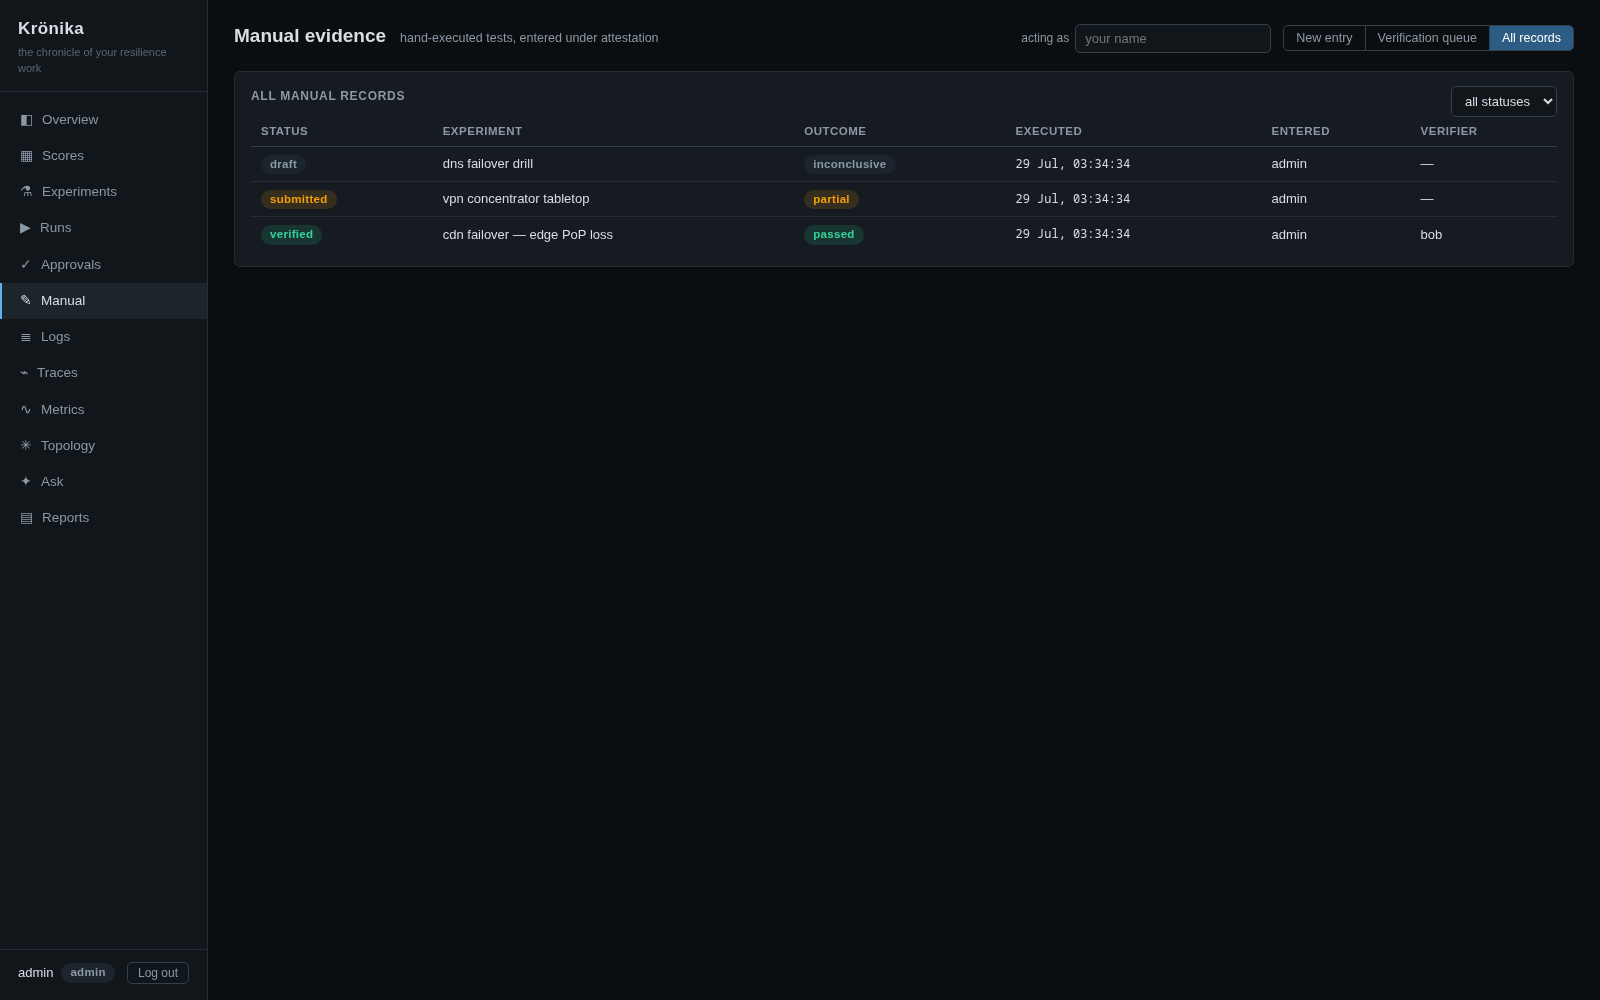
Manual evidence covers what telemetry can’t: game days, tabletops, vendor failovers. Records move draft → submitted → verified with reviewer ≠ enterer (the register below shows a verified record with bob-admin as verifier), each transition appended to a hash-chained audit trail.
Author from the catalog
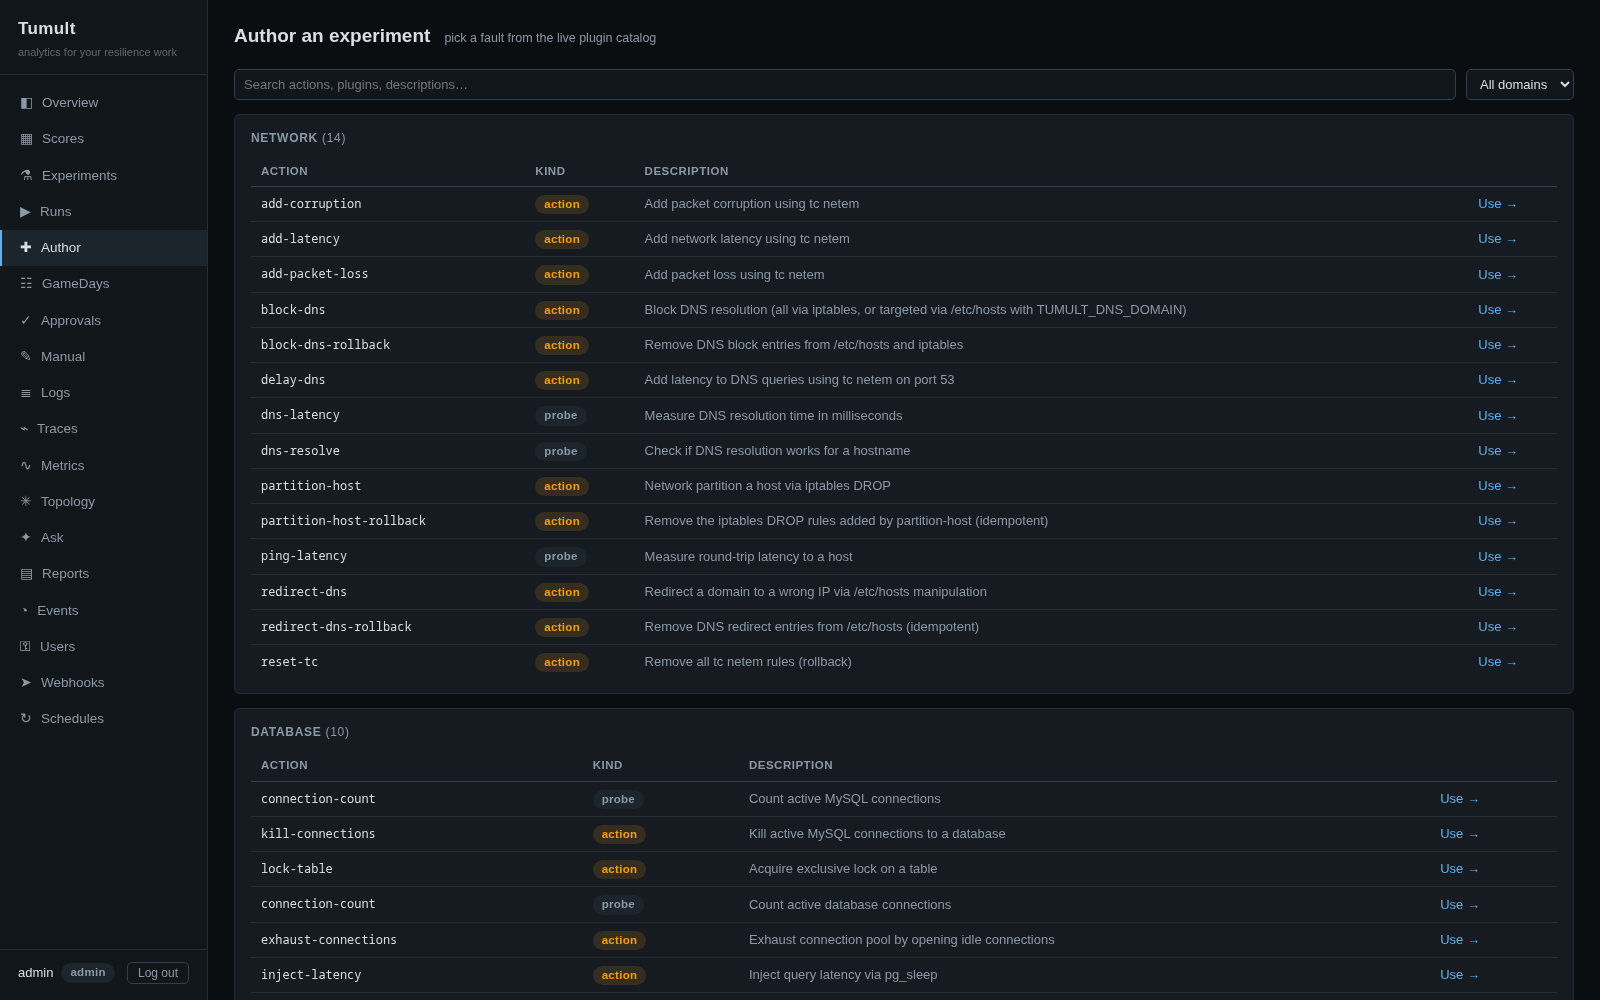
The Author page browses the live fault catalog — every action and probe the mounted plugins expose, grouped by domain — and scaffolds a definition from any of them without leaving the UI.
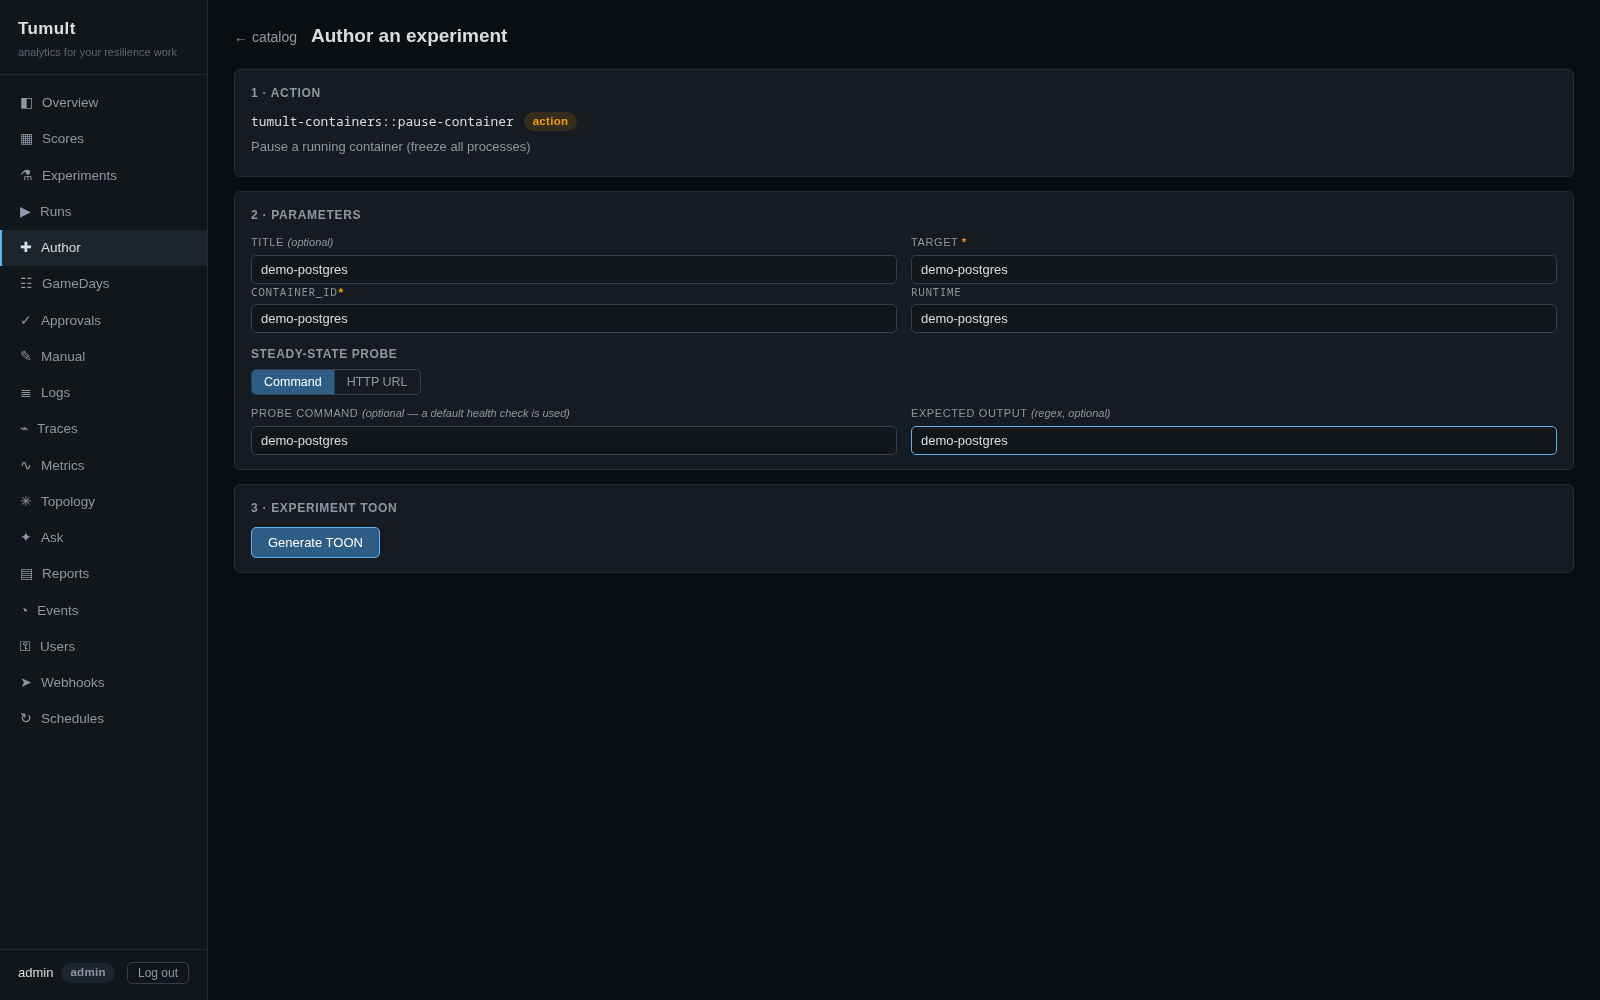
Picking an action opens the scaffolding wizard: title, target, the action’s arguments, and an optional steady-state probe, then a generated TOON ready to validate and register.
The same catalog and scaffolding are available over the API — the same code paths as the MCP tumult_fault_catalog / tumult_scaffold_experiment tools, with no MCP hop:
curl http://localhost:14318/api/authoring/catalog      # domains → actions → args
curl -X POST http://localhost:14318/api/authoring/scaffold \
  -H 'Content-Type: application/json' \
  -d '{"plugin":"tumult-containers","action":"pause-container",
       "args":{"container_id":"demo-postgres"},"target":"demo-postgres"}'
Both endpoints are Viewer-level and persist nothing — the scaffolded TOON registers through POST /api/runs/validate like any other definition.
Register and run an experiment
Registration happens via the API or the CLI — the definition is validated by the exact pipeline the CLI uses and content-hash-deduped into the registry:
curl -X POST http://localhost:14318/api/runs/validate \
  -H "Cookie: kro_session=<session>" -H 'Content-Type: application/json' \
  -d "{\"toon\": $(jq -Rs . < demo/kronika/experiments/config-corruption.toon)}"
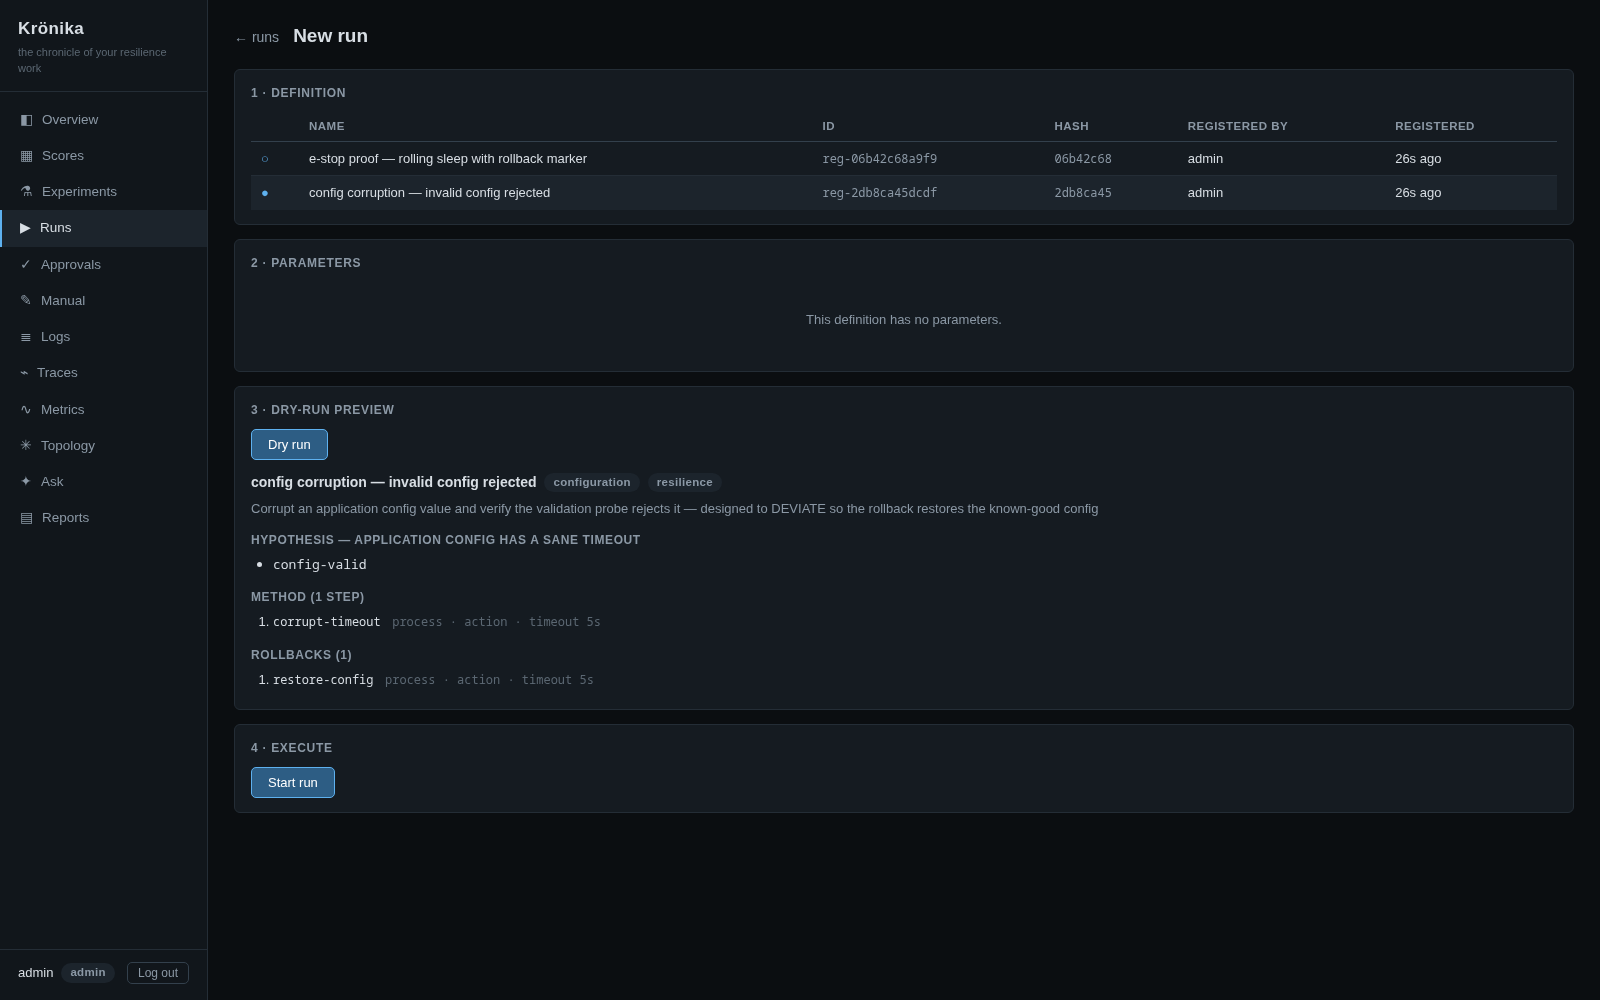
The Run page then drives the whole loop: pick the registered definition, fill any ${var} parameters, dry-run the exact resolved plan — hypothesis, method steps, rollbacks — and start.
Approval gate
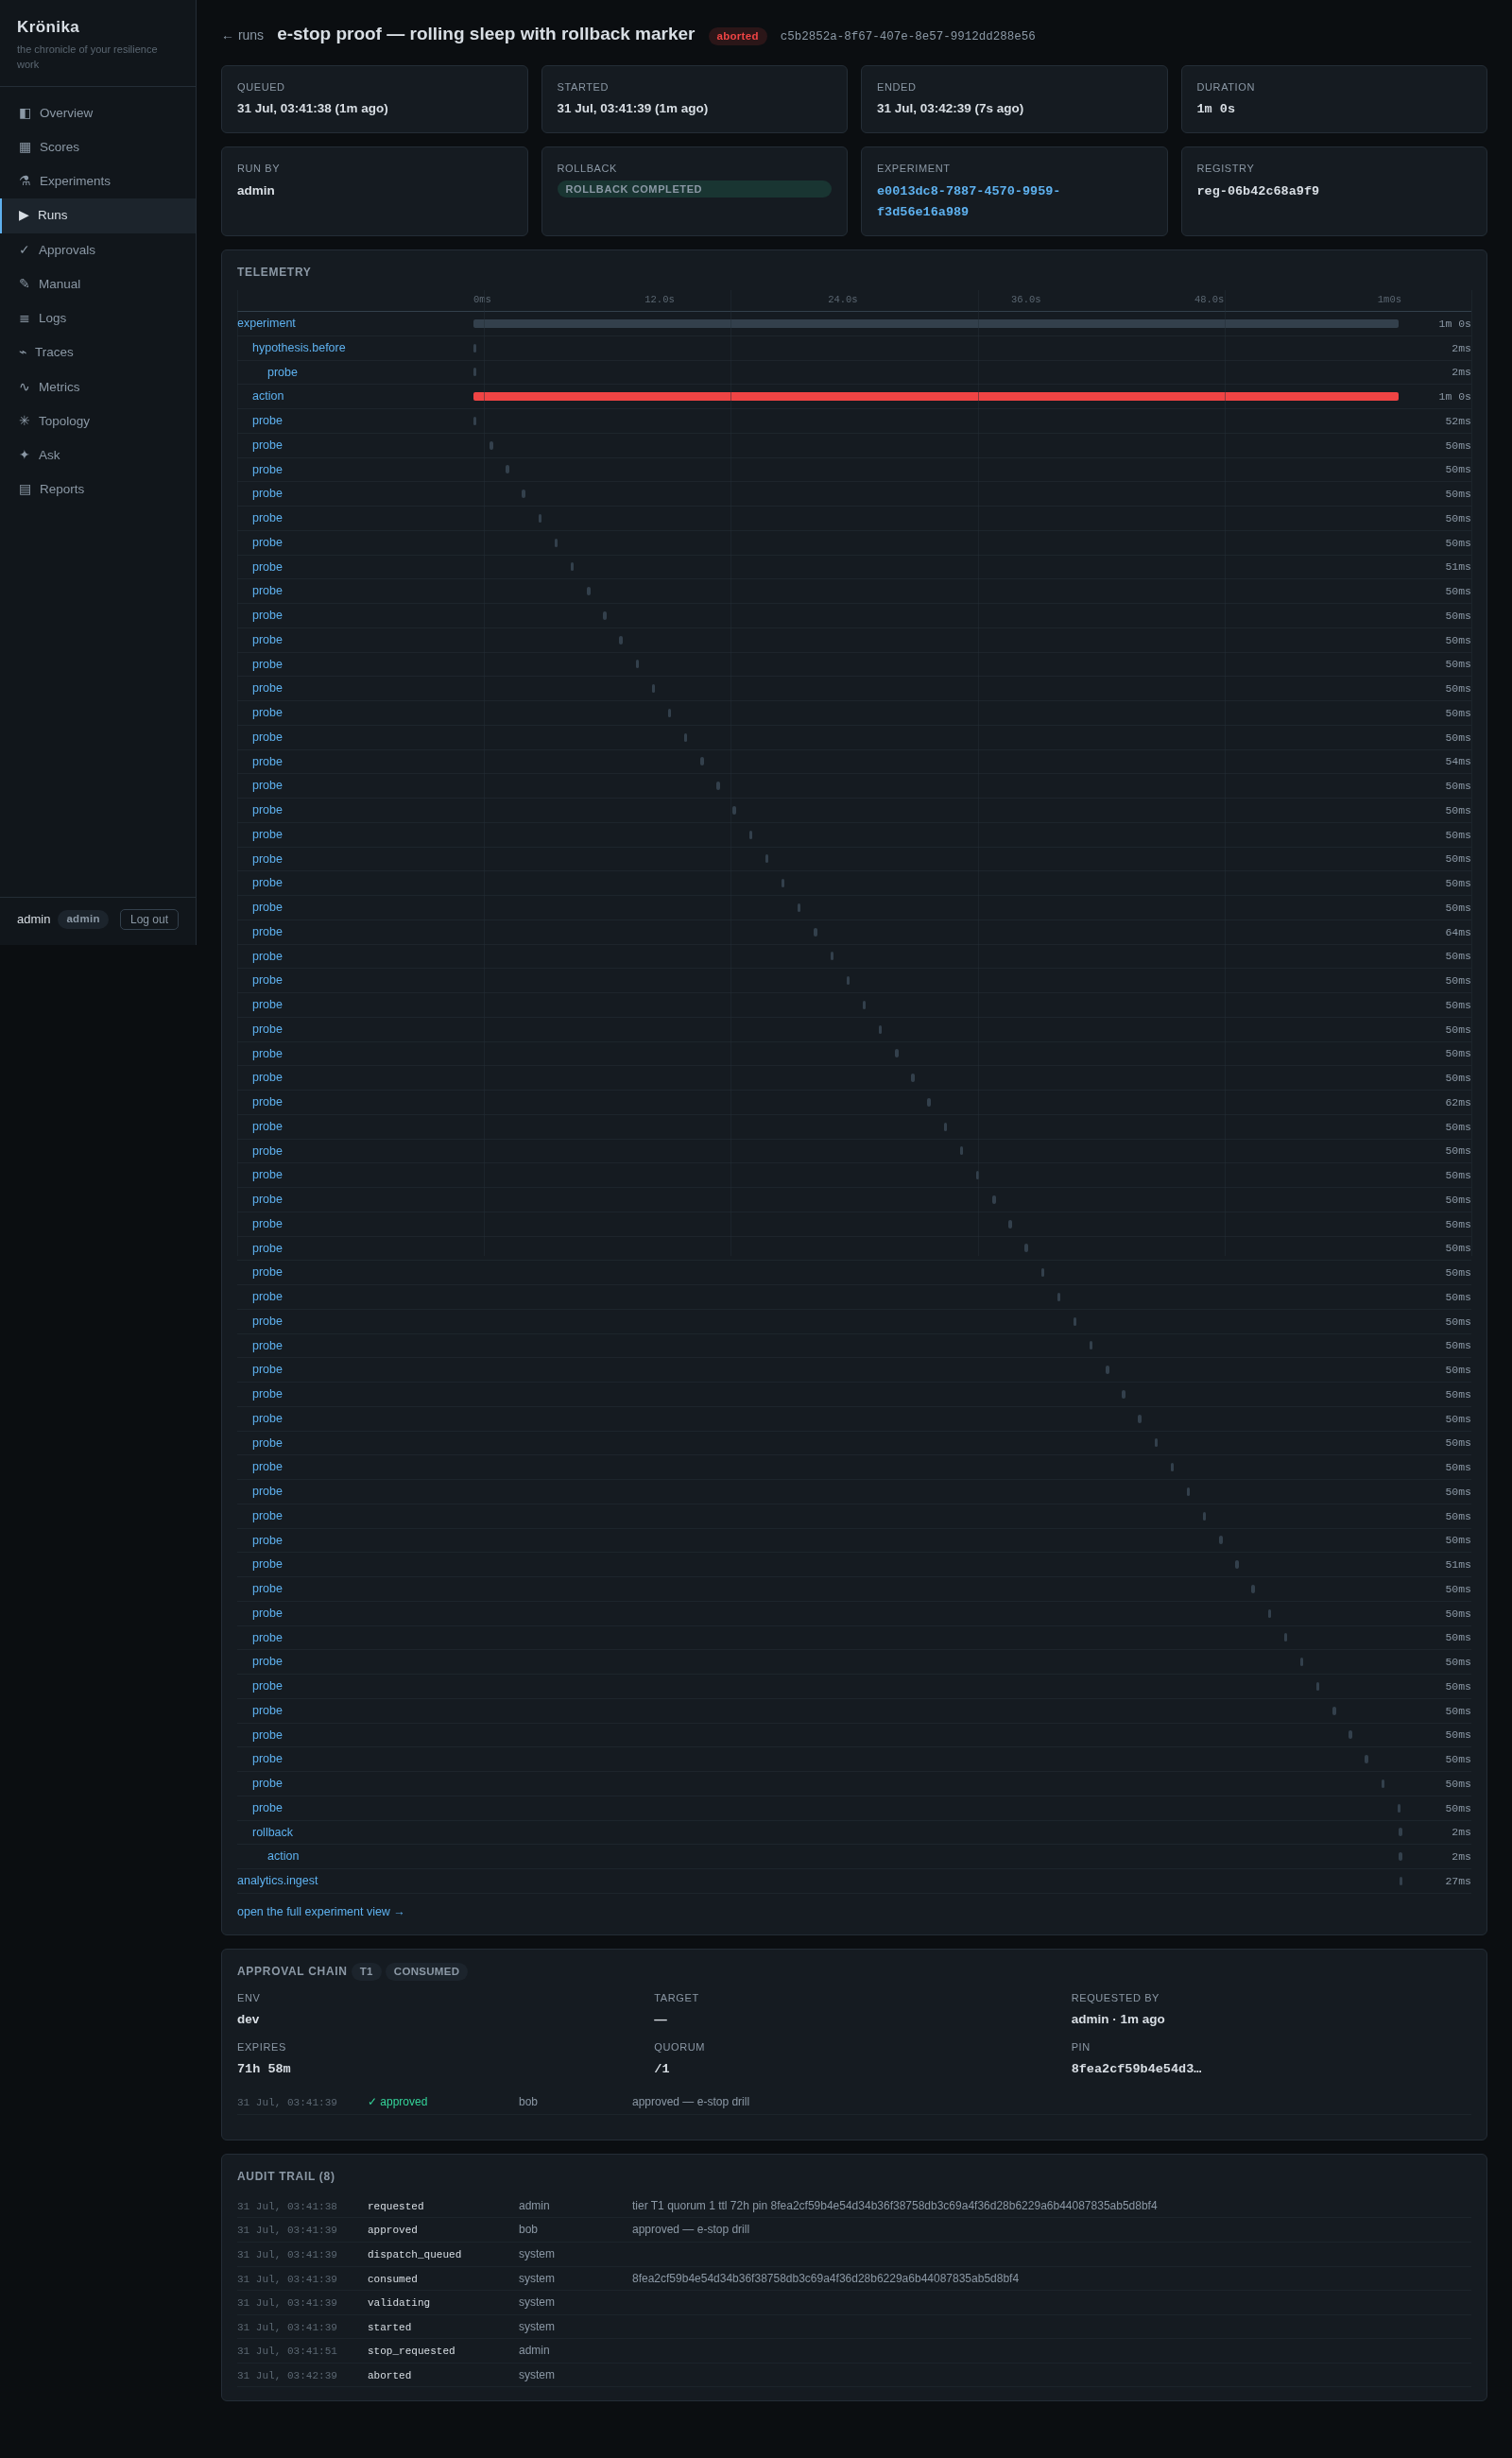
Run creation is change management. The definition’s frozen facts classify the run into a risk tier; this one is T2, so it parks in pending_approval behind a quorum of one approver, with a SHA-256 pin over the resolution inputs, a 24h TTL, and single-use consumption at dispatch.
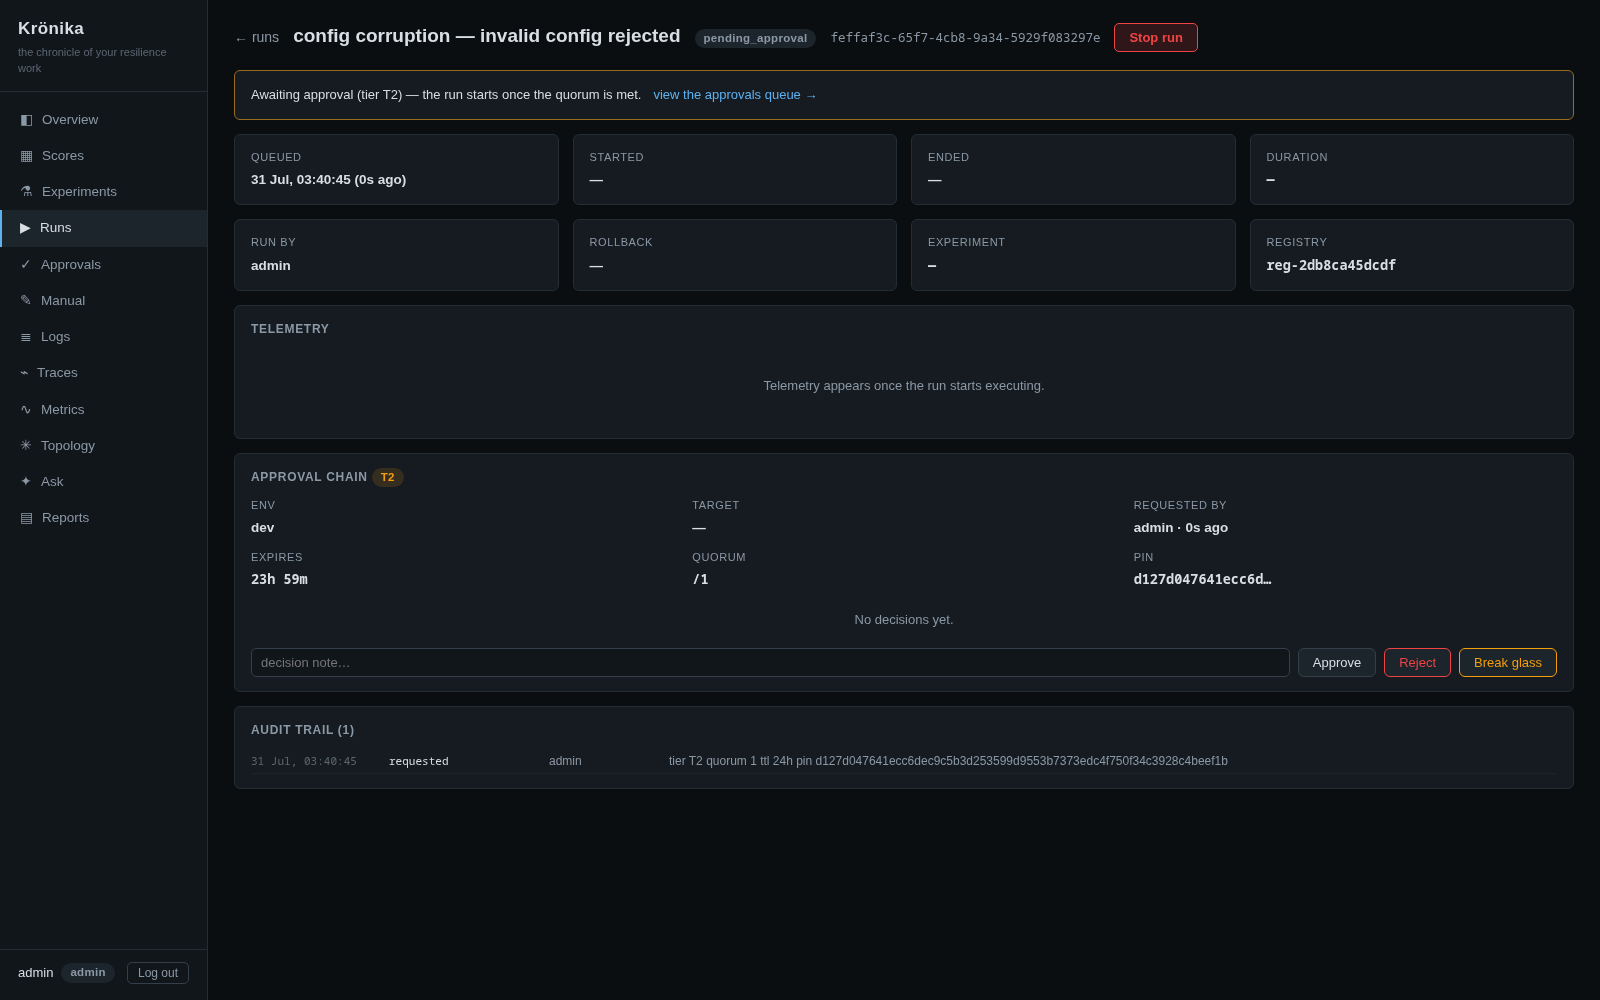
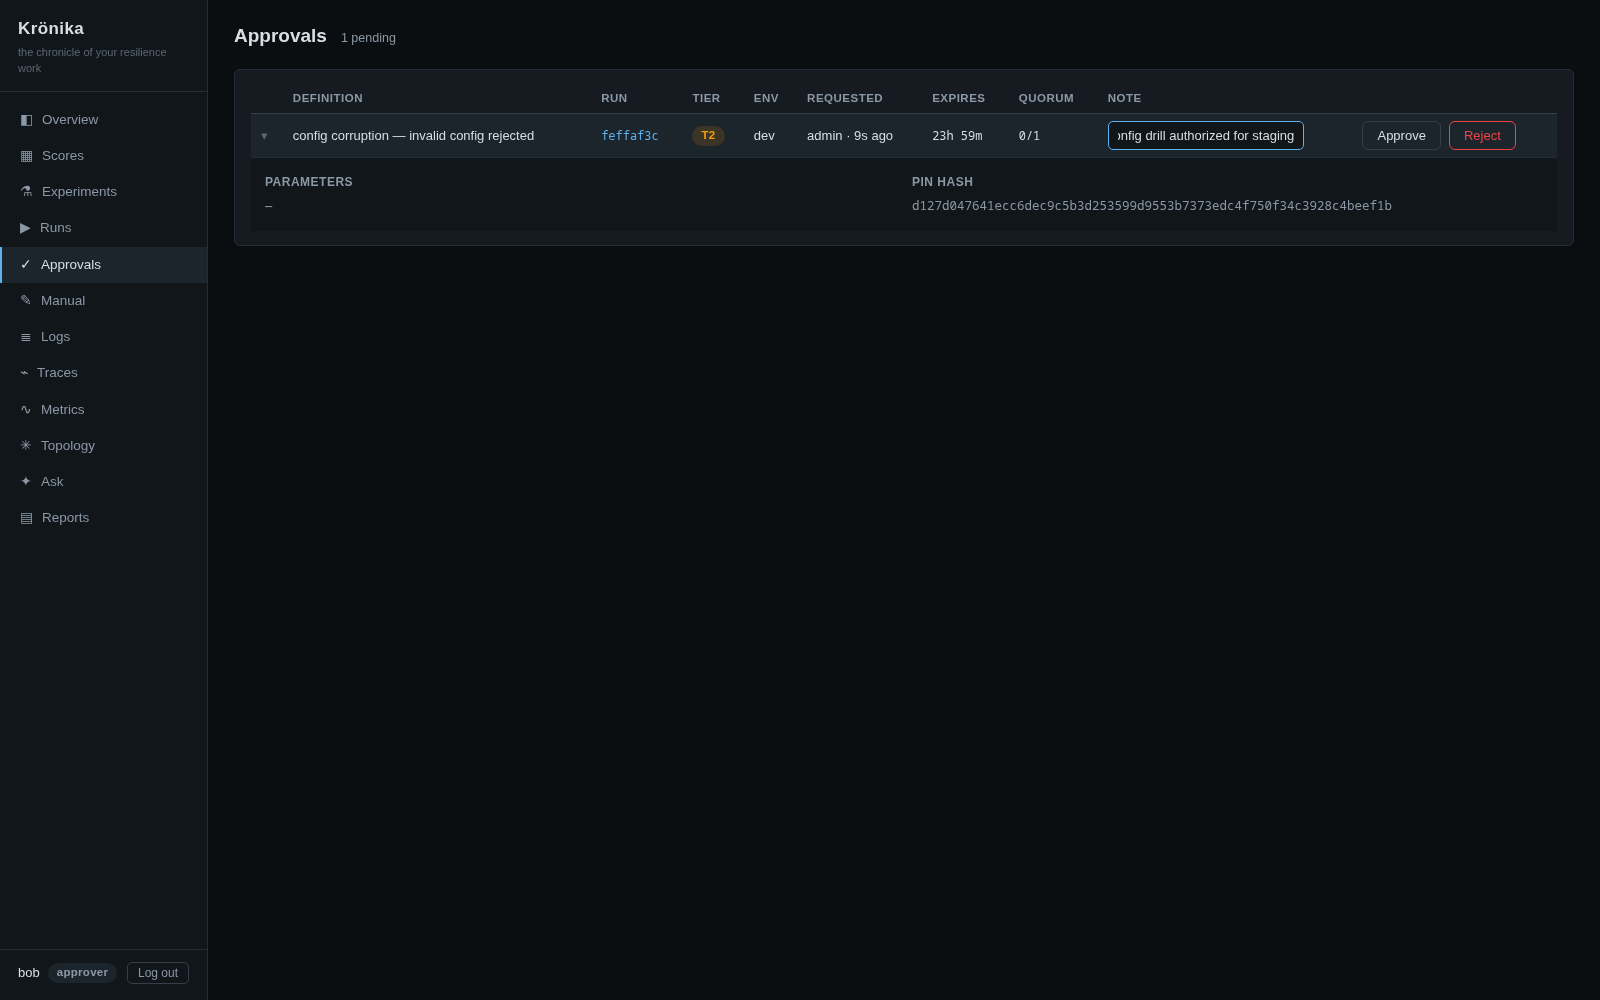
Segregation of duties is enforced by the writer: the requester can never approve their own run. A second identity — bob-admin — reviews the pending request in the queue against its pin and records a decision note.
The executed run
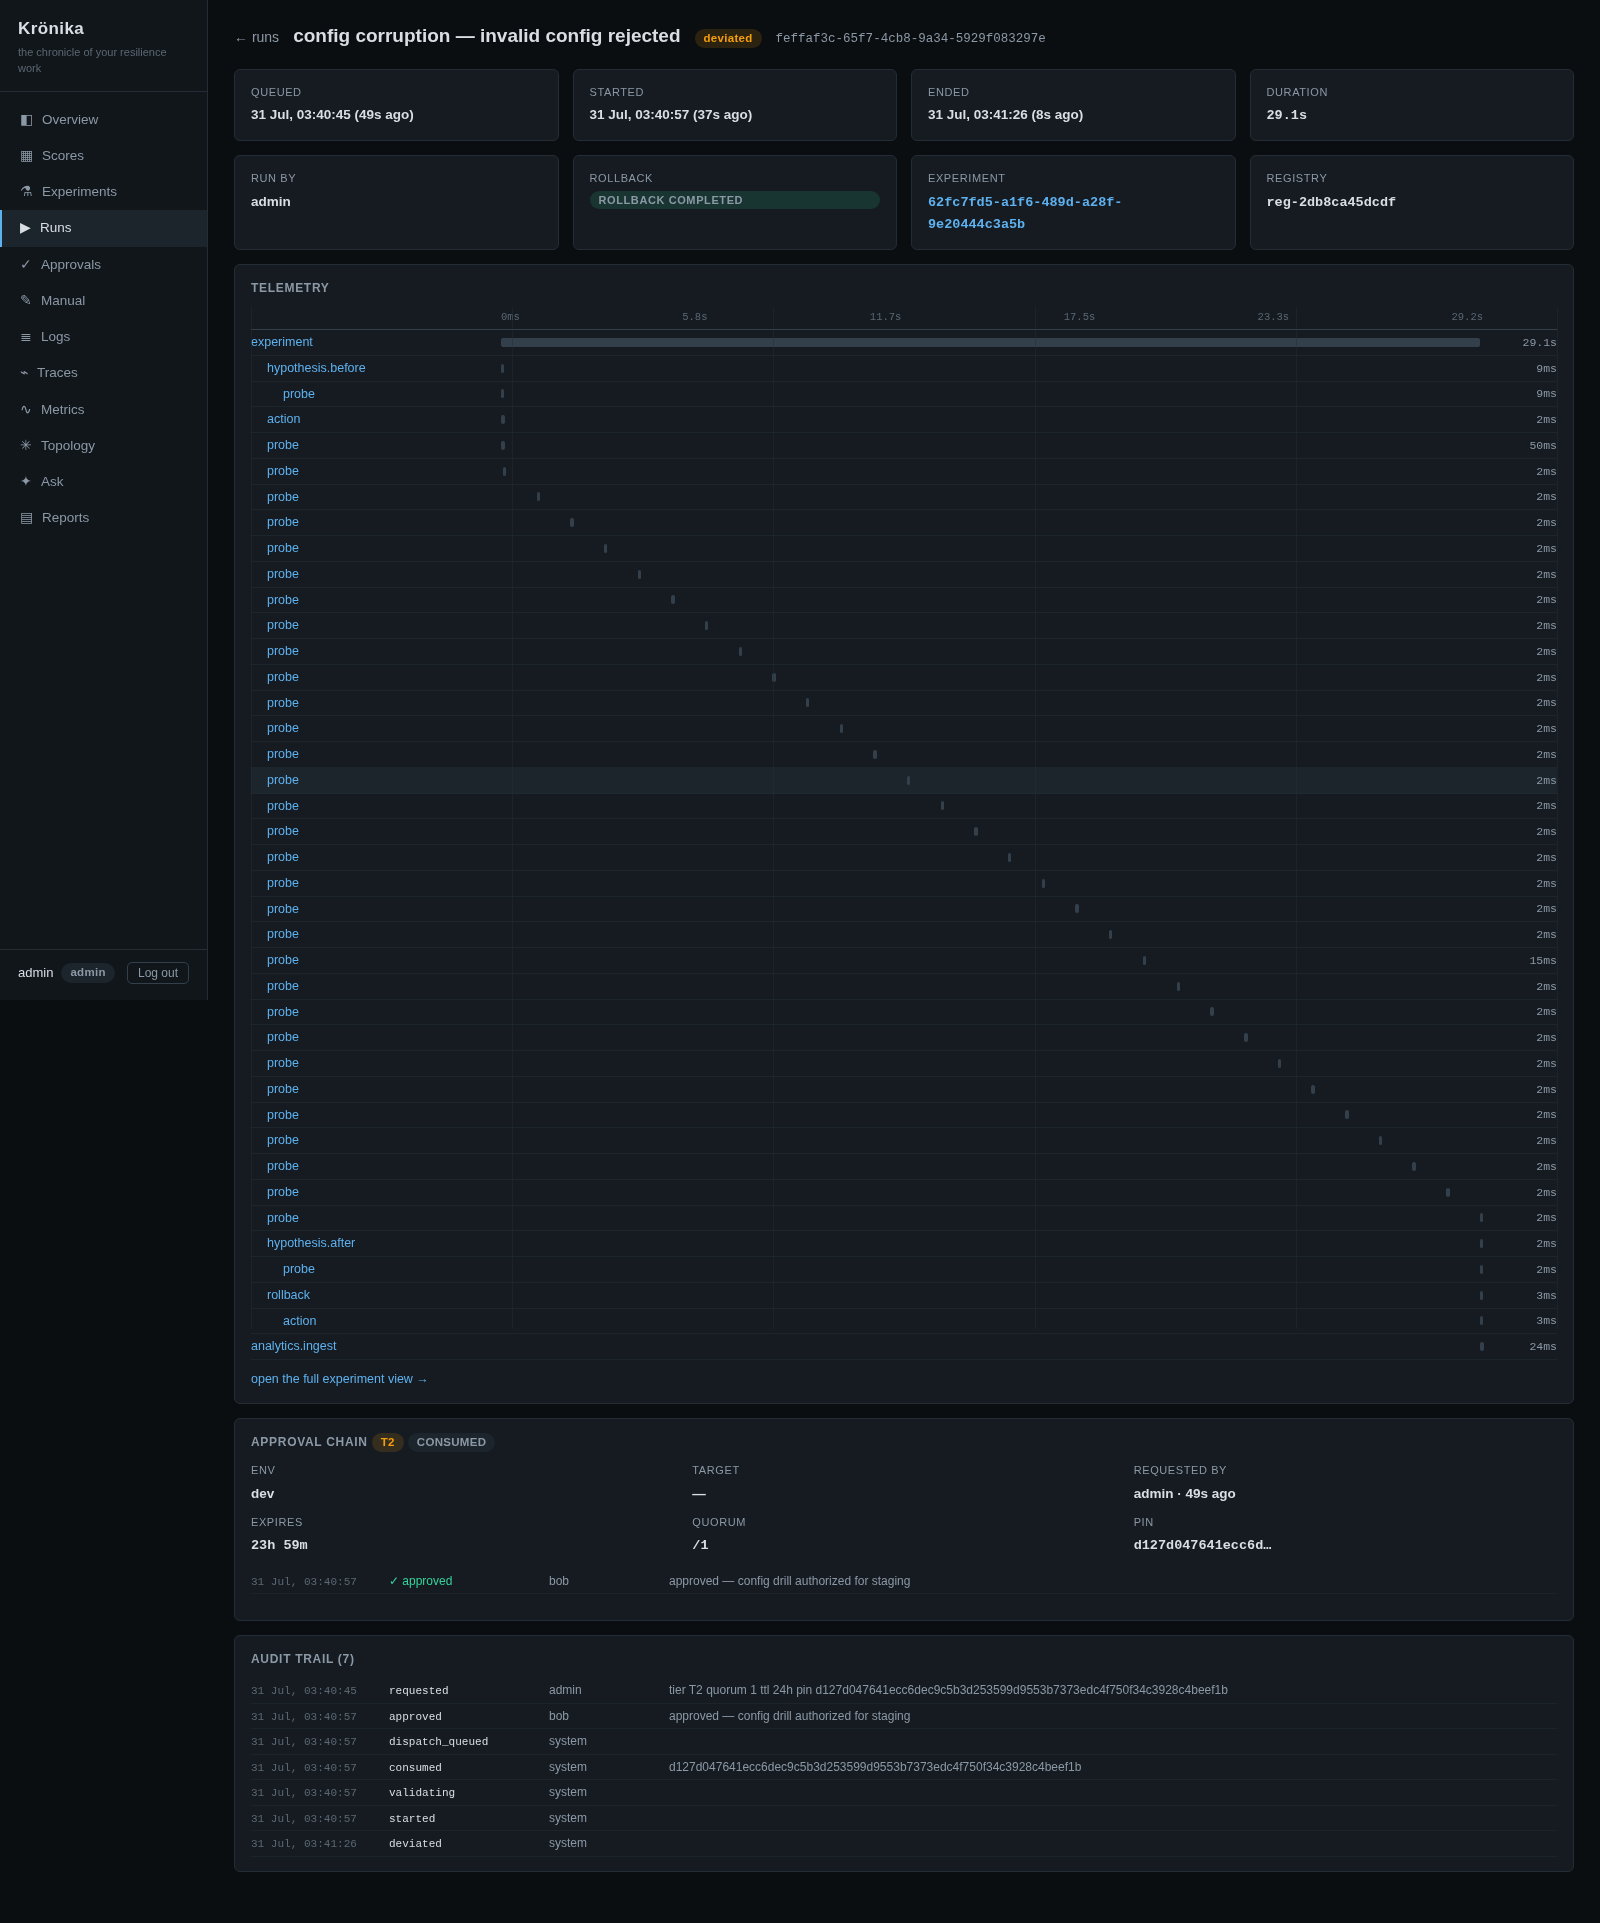
Once approved, the run dispatches onto the worker pool and its page polls to terminal. The detail page is the whole story on one screen: the telemetry waterfall as loopback spans land (here the steady-state probe failed, so the run aborted and the rollback restored the target), the consumed approval chain with bob-admin’s note, and the per-run hash-chained audit trail from requested through approved, dispatch_queued, consumed, started, aborted.
E-stop a gated run
A second gated run — the pause-container definition parked in pending_approval — is stopped before it ever dispatches. The two-step e-stop is deliberate: the first click arms, the confirm halts the run before the next activity and unwinds rollbacks.
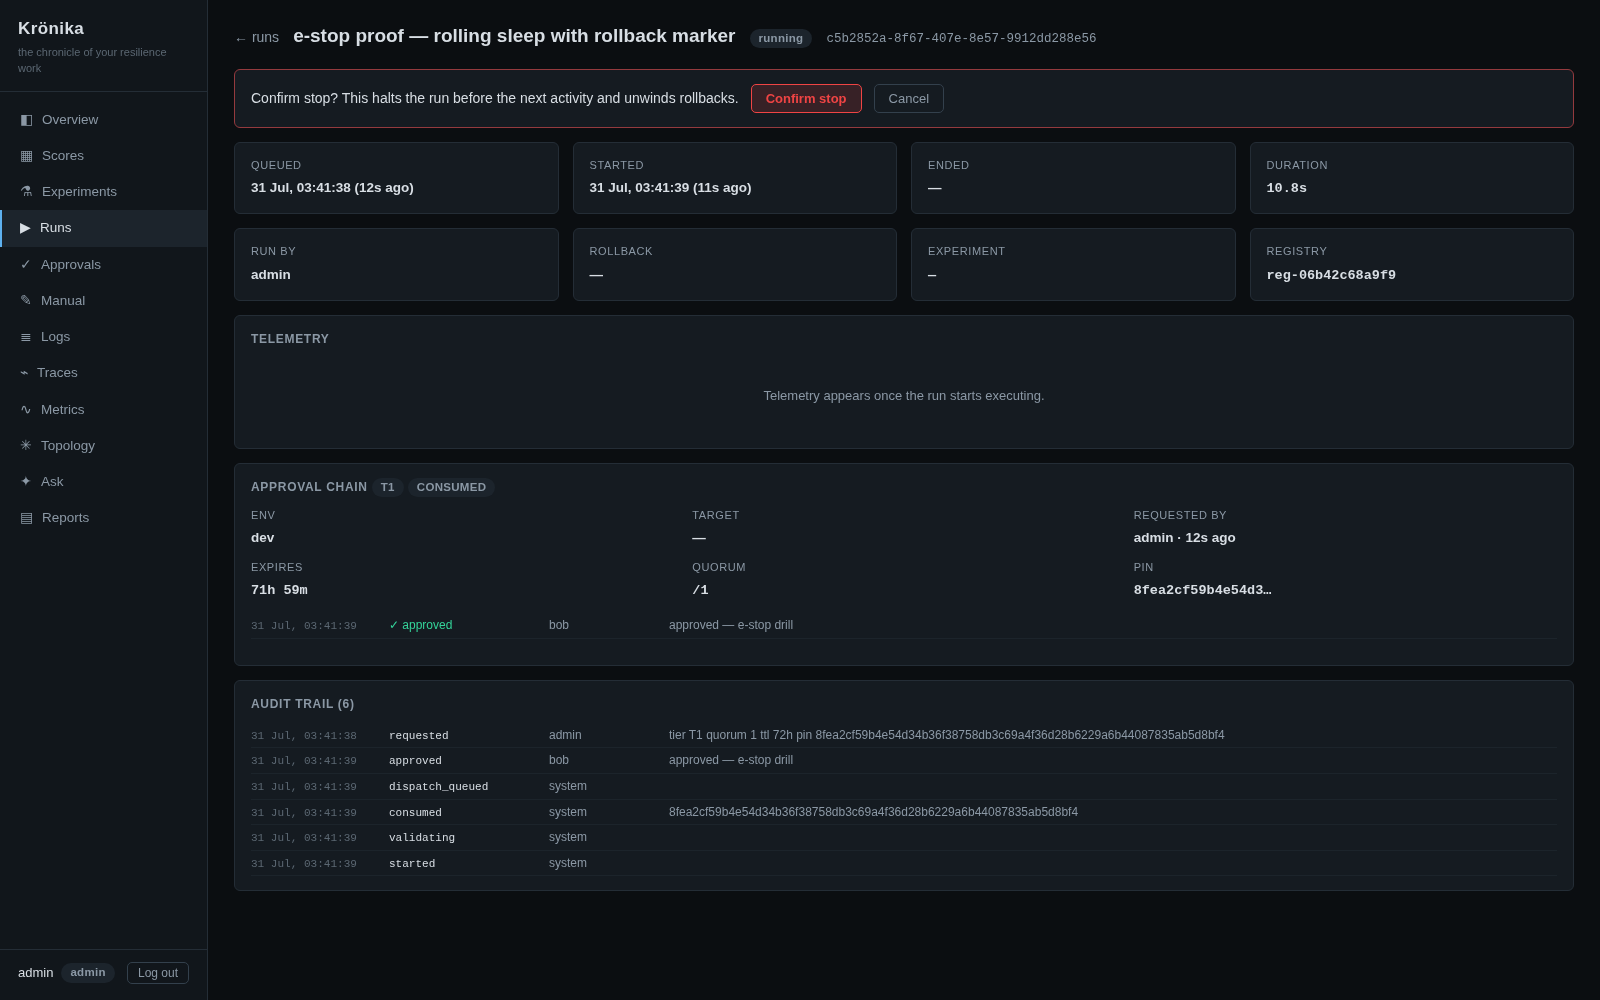
The result: state aborted, “cancelled before start”, stop_requested attributed to the operator in the audit trail, and the approval request closed out — no approval can resurrect a stopped run. The Runs page also carries a global two-step Halt all for stopping everything active at once.
Evidence pack
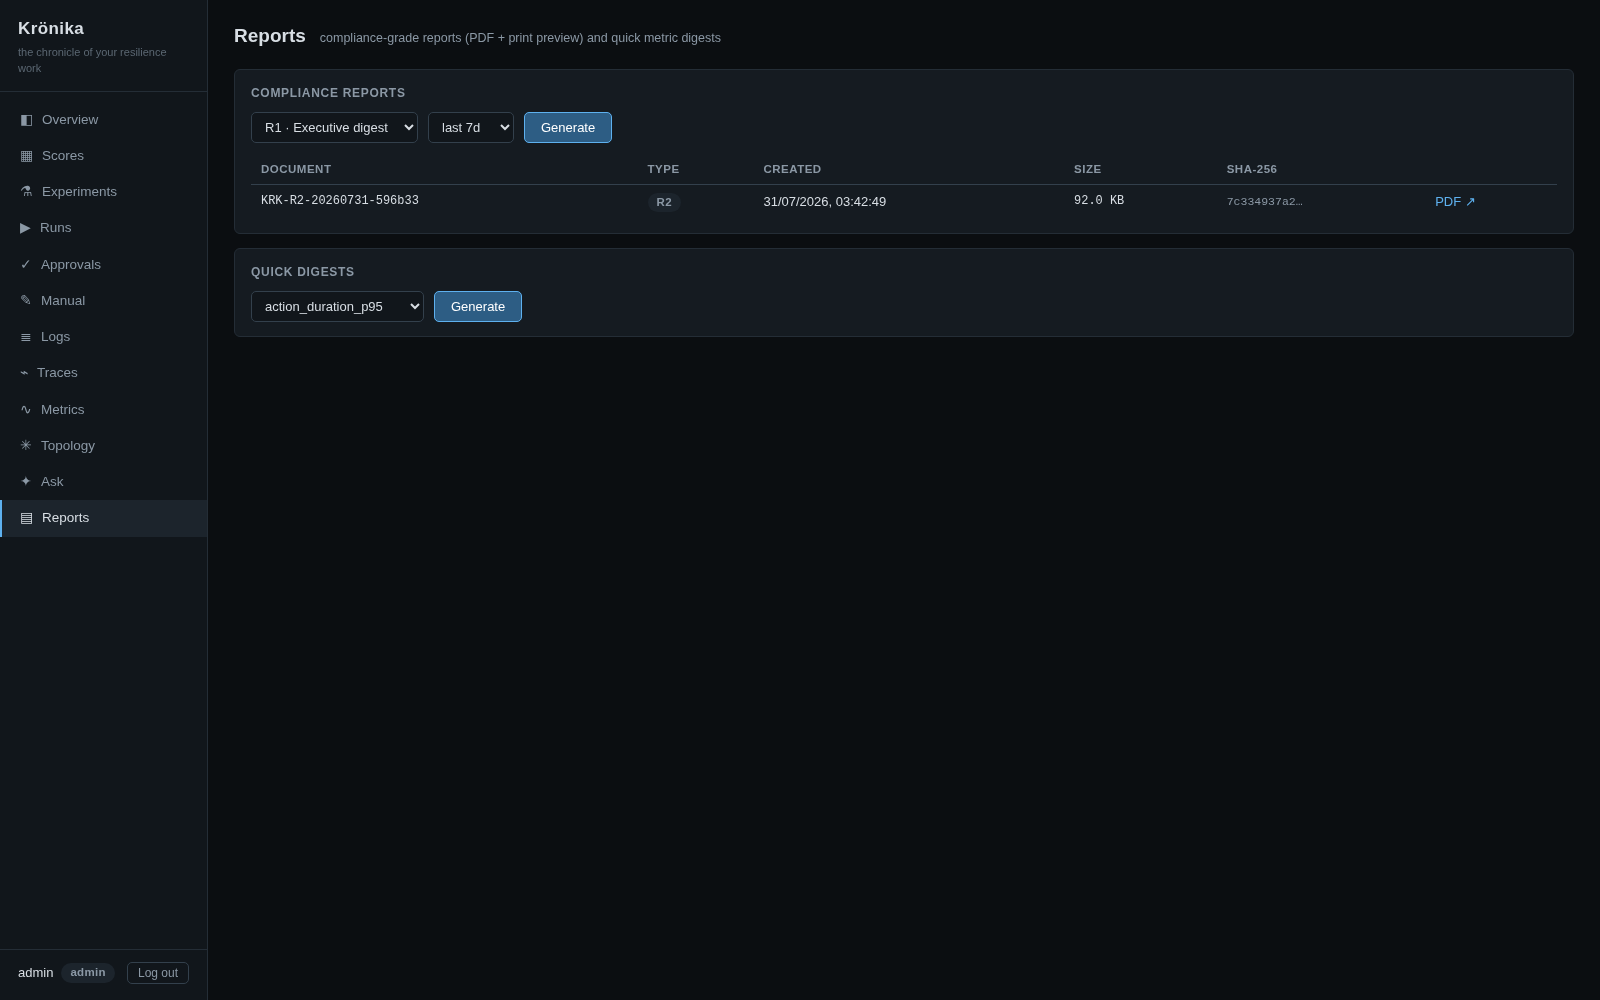
Finally, the compliance story: R1 executive digests, R2 evidence packs (DORA/NIS2/ISO 27001/SOC 2), and R3 game-day reports are generated from the store as document-controlled PDFs. The R2 pack includes the approval chain of every gated run in the window (SOC 2 CC8.1) — the two runs above, bob-admin’s approval included.
Reports respect the same per-user environment scopes as the rest of Tumult. A user scoped to specific environments generates digests, evidence packs and metric reports containing only those environments’ data, and each generated artifact records the coverage it was built from. Scoped users then see only artifacts whose coverage lies inside their own scopes; global reports and older artifacts without coverage metadata stay visible to unscoped users only (a scoped user gets a 404, as with out-of-scope traces). Unscoped users see and generate everything, exactly as before.
Operate the platform
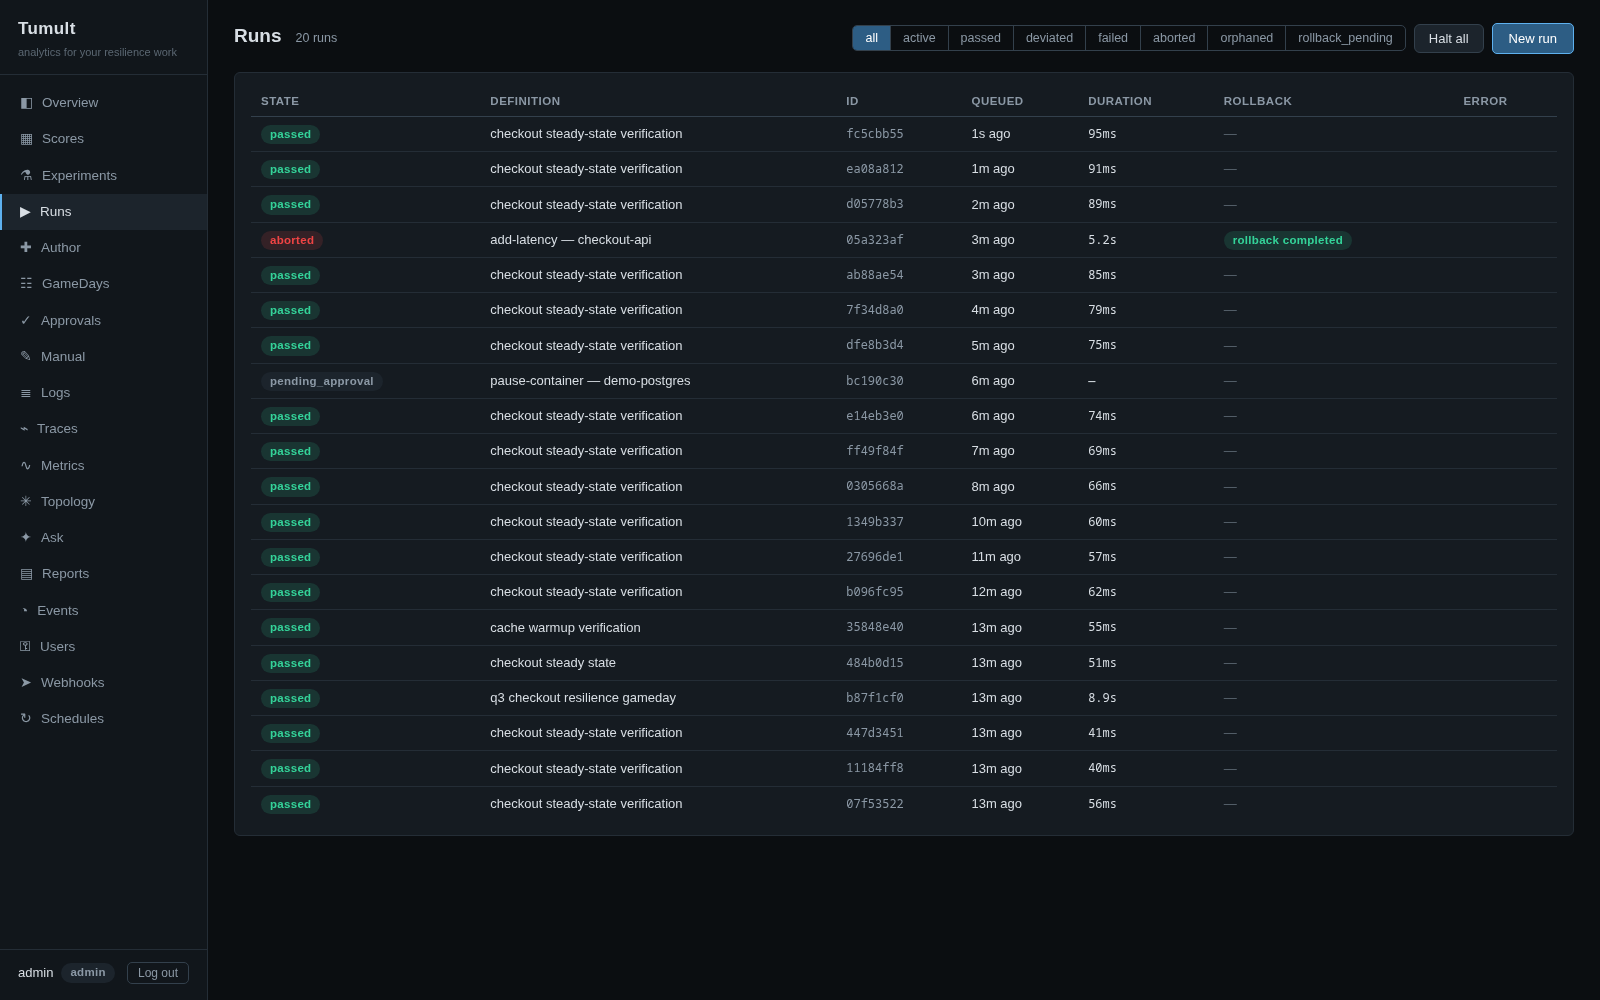
The remaining nav pages cover day-to-day operation. The Runs page lists every run with state filters and the global Halt all — the same two-step arm/confirm as the per-run e-stop, stopping everything active in one shot.
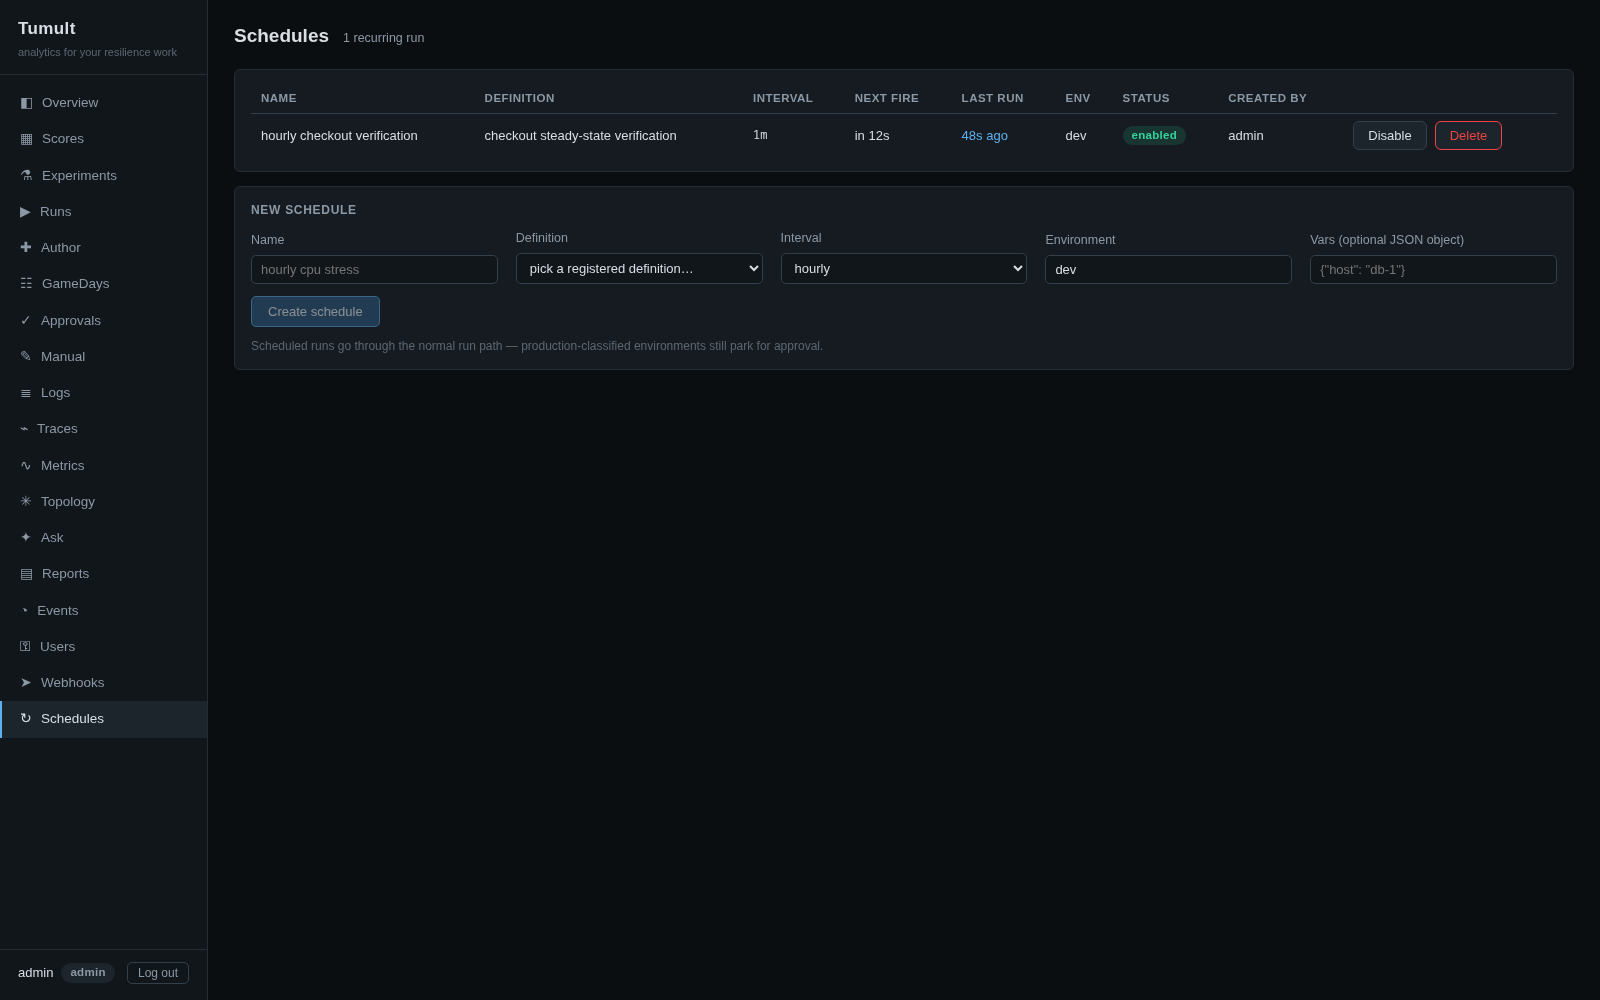
Schedules fire registered definitions on an interval through the normal run path — production-classified environments still park for approval.
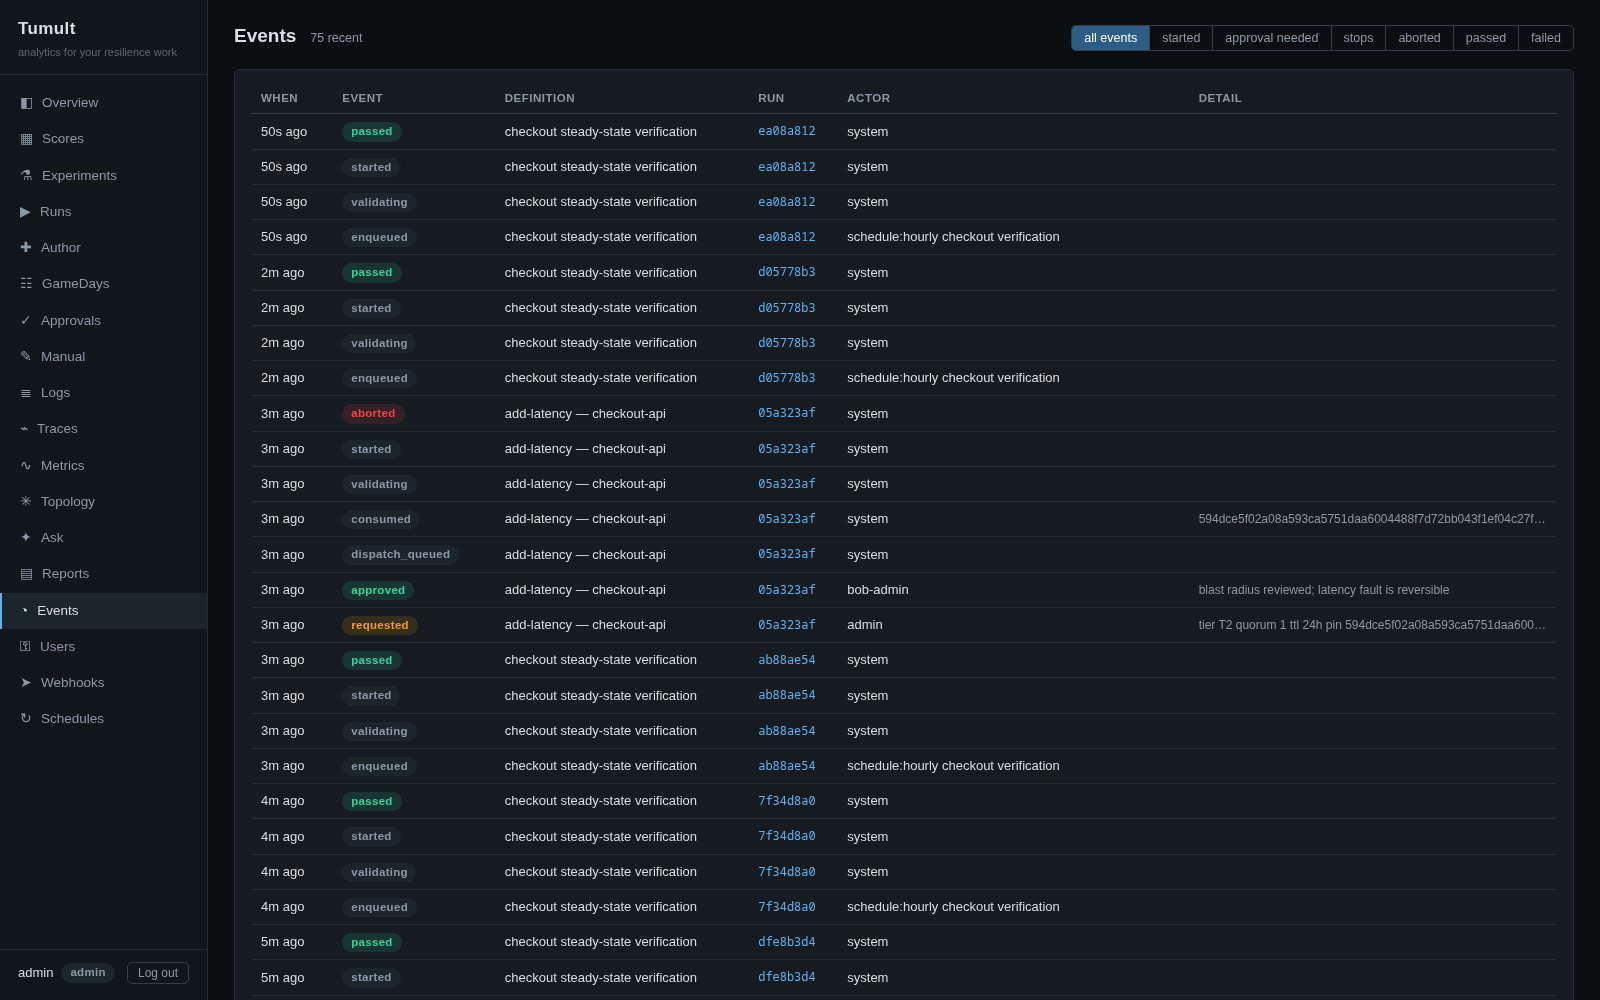
The events feed is the audit spine across runs: every requested, approved, started, passed, aborted, and stop_requested, newest first, attributed to the actor (including schedules).
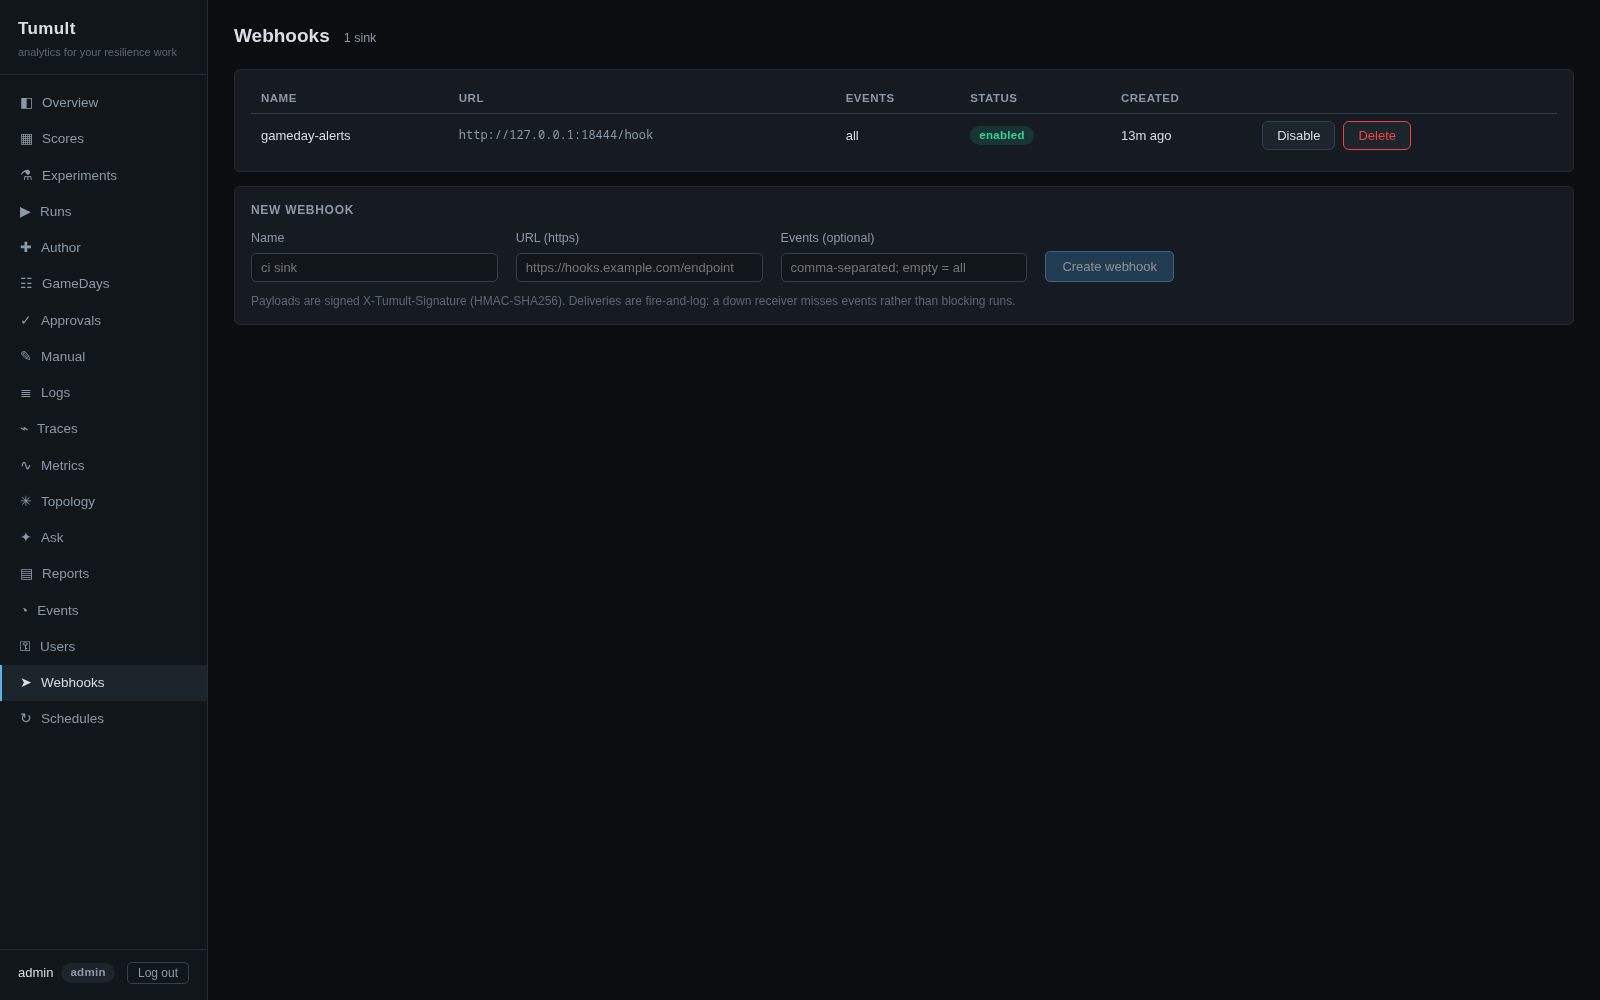
Webhooks push those same events to external sinks, each payload signed X-Tumult-Signature (HMAC-SHA256) with a per-hook secret shown once at creation.
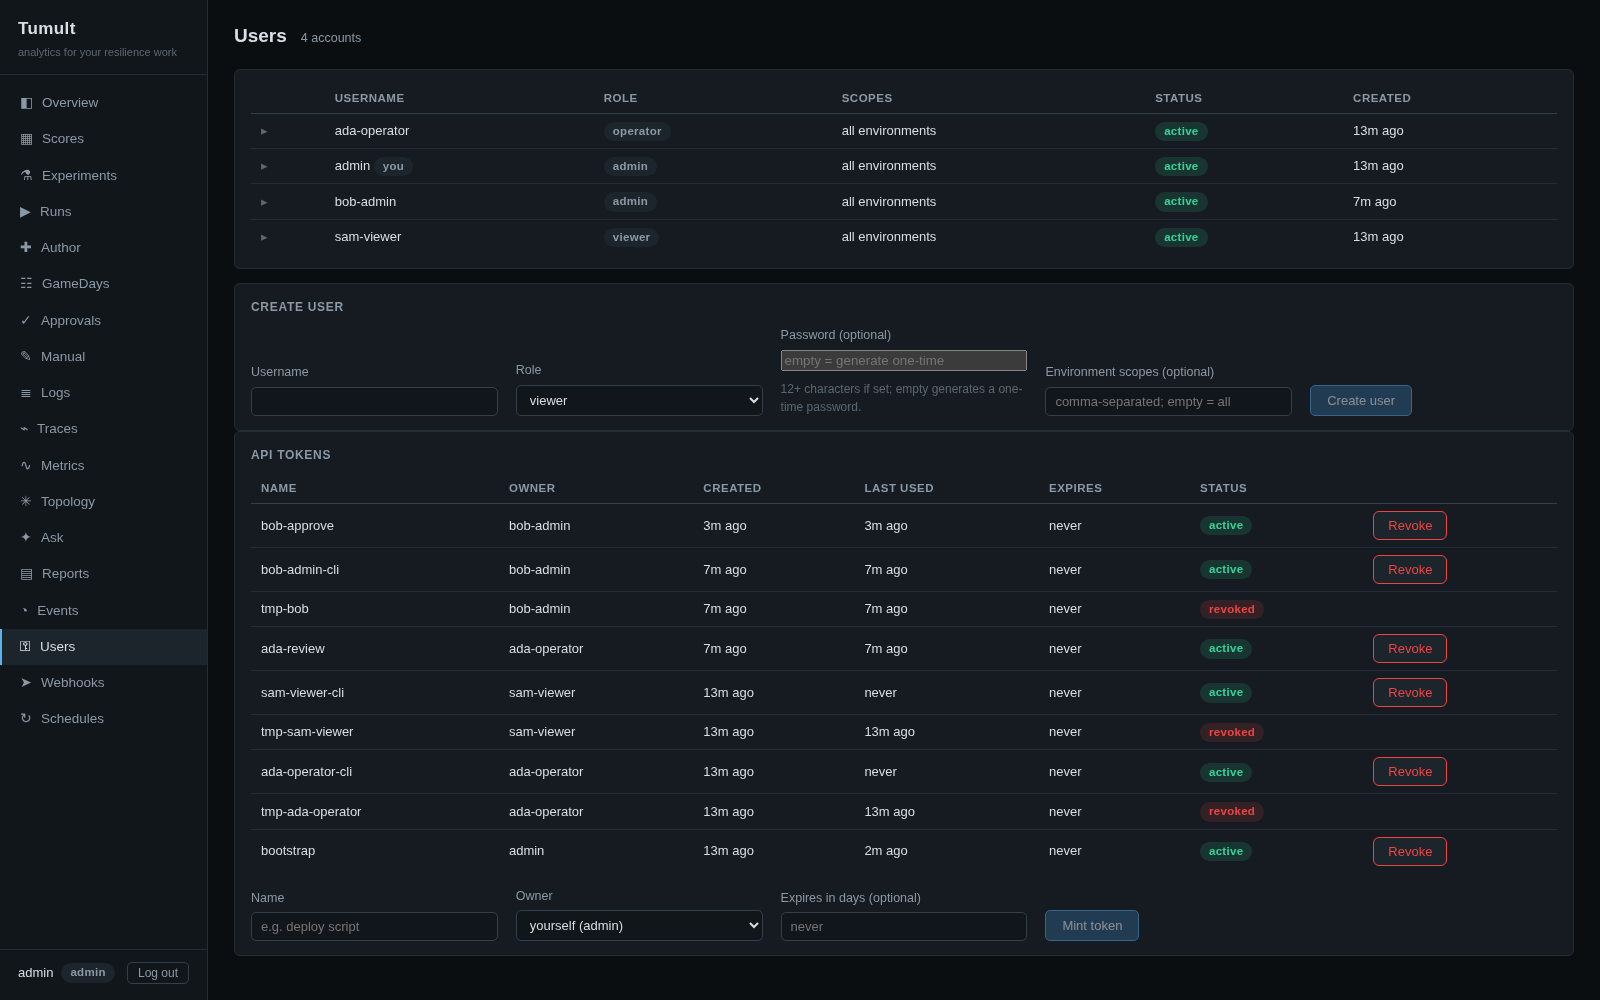
Users manages accounts and revocable kro_ API tokens under viewer < operator < approver < admin roles, with optional per-environment scopes.
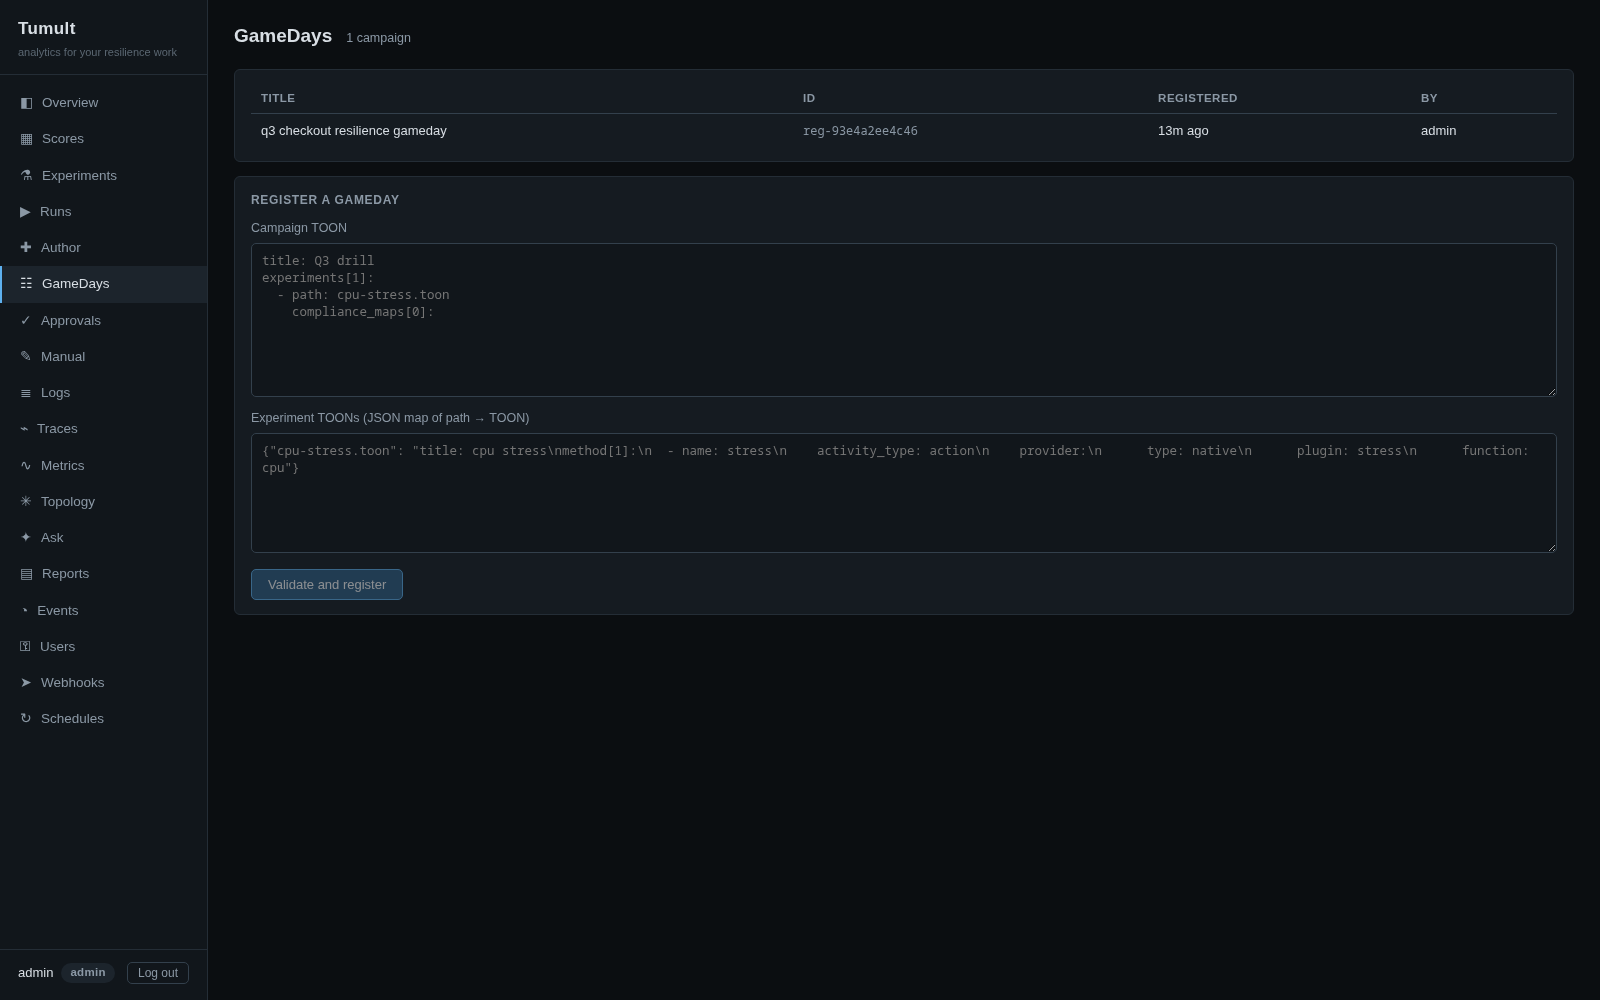
GameDays group experiments into scored campaigns — register the campaign TOON, launch it, and the child runs execute in order under the same approval tiers.
Where next
- Analytics architecture — the single-writer lake, run queue, approval pinning, and report pipeline behind these screens.
- Production deployment — binaries, containers, hardening.
- CLI reference — the same loop from the command line.