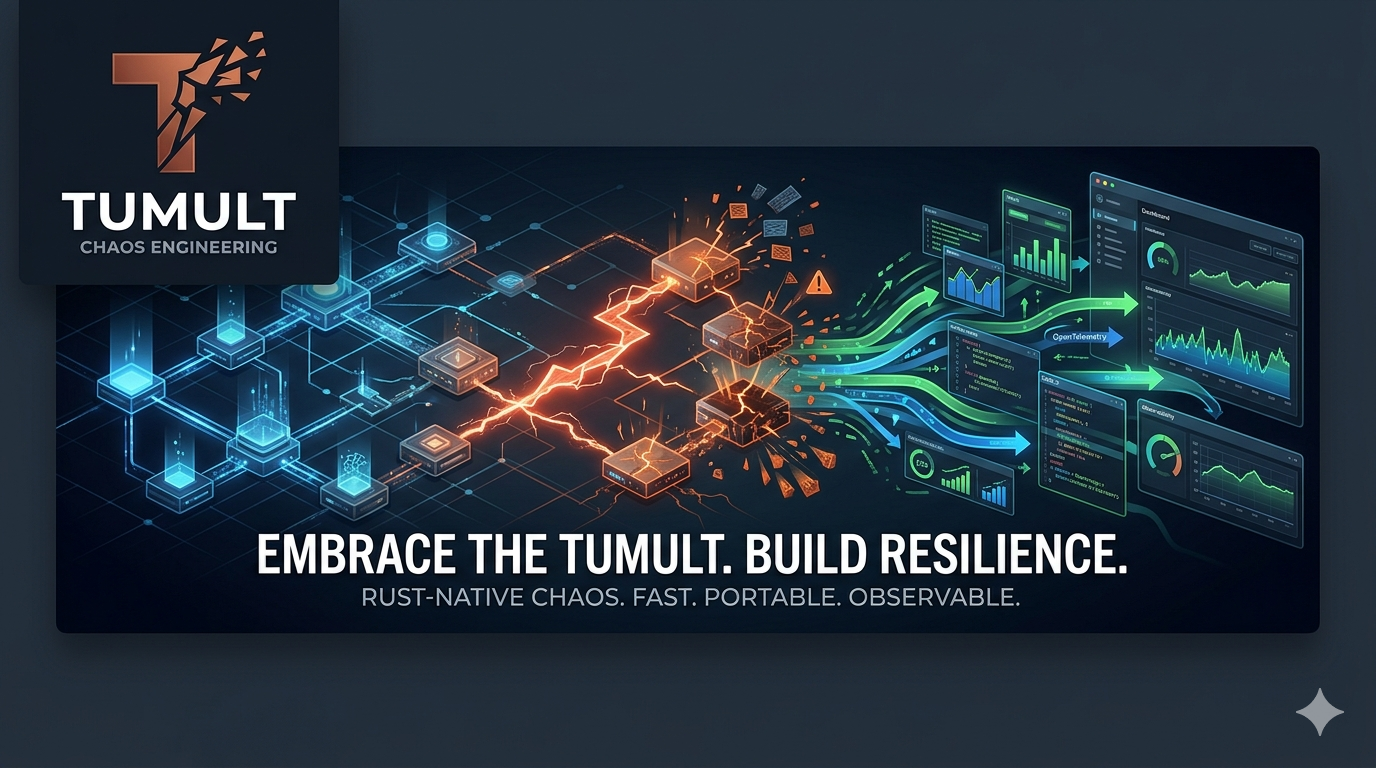
Embrace the Tumult
Rust-native chaos engineering. GameDay orchestration with resilience scoring. DORA/NIS2 compliance mapping. MCP server for agent fleets. Every result flows into DuckDB analytics — queryable, exportable, audit-ready.
⚡ Single Binary
One static binary — no Python, no runtime dependencies. Pre-built for macOS (x86_64/aarch64) and Linux (x86_64 gnu/musl, aarch64 musl). Copy it to your PATH and run experiments.
📡 Native OpenTelemetry
Every experiment emits real OTel spans across SSH, Kubernetes, plugins, baselines, analytics, and MCP dispatch. Traces appear in Jaeger, SigNoz, or any OTLP backend — no configuration.
🔍 Embedded Analytics
Journals flow through Apache Arrow into DuckDB. SQL over your chaos history, export to Parquet, trend analysis across hundreds of runs. The data pipeline is built in, not bolted on.
🔌 13 Plugins, 64 Actions
PostgreSQL, MySQL, Redis, Kafka, Docker, Podman, Pumba network chaos, Kubernetes, SSH remote execution, userspace TCP chaos proxy, CPU/memory/IO stress. Write your own in any language — just scripts + a manifest.
📋 Regulatory Compliance
Map experiments to DORA (EU 2022/2554), NIS2, PCI-DSS 4.0, ISO 22301, ISO 27001, SOC 2, and Basel III. Journals are audit artifacts. Evidence reports generated from data.
🛡️ Memory Safe
100% safe Rust across all 15 crates. Zero unsafe blocks in production code. Zero production .unwrap(). Clippy pedantic enforced. cargo-audit on every commit.
🎯 GameDay Orchestration
Coordinated campaigns of experiments with shared load, resilience scoring, and compliance article mapping. One command: 4 experiments, DORA/NIS2 evidence, audit-ready journal.
🌐 MCP Server (HTTP/SSE)
24 MCP tools over stdio or HTTP/SSE, with tool annotations, structured output schemas, and tumult:// resources. Agent fleets, CI/CD pipelines, and quality engineering systems connect via standard Streamable HTTP protocol.
🔌 Agent-Ready
TOON format is 40-50% more token-efficient than JSON. Pre-built Docker images on GHCR. Any MCP-compatible agent can discover plugins, run experiments, query analytics, and generate compliance reports.
🐳 Docker Images
Pre-built on GHCR — no Rust toolchain needed. docker pull ghcr.io/mwigge/tumult. Composable bundles: infra, observability, MCP server, agent fleet. Full e2e in one command.
📡 SigNoz Observability
OTel Collector (contrib) with OTLP + Arrow receivers, span-to-metrics APM, host metrics, Prometheus. Traces flow to SigNoz — dashboards, alerting, log aggregation. No custom build needed.
See It in Action
GameDay: One Command, Full Compliance
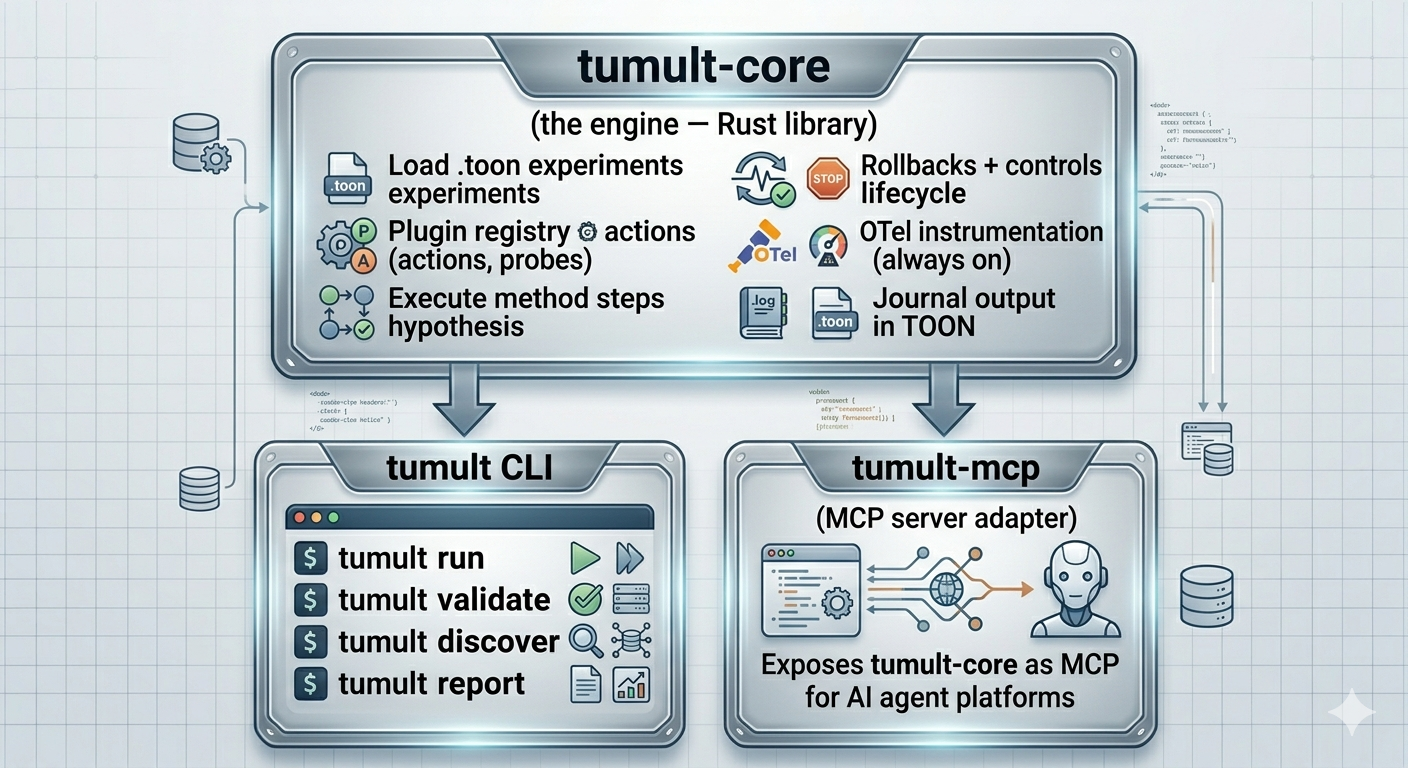
Architecture
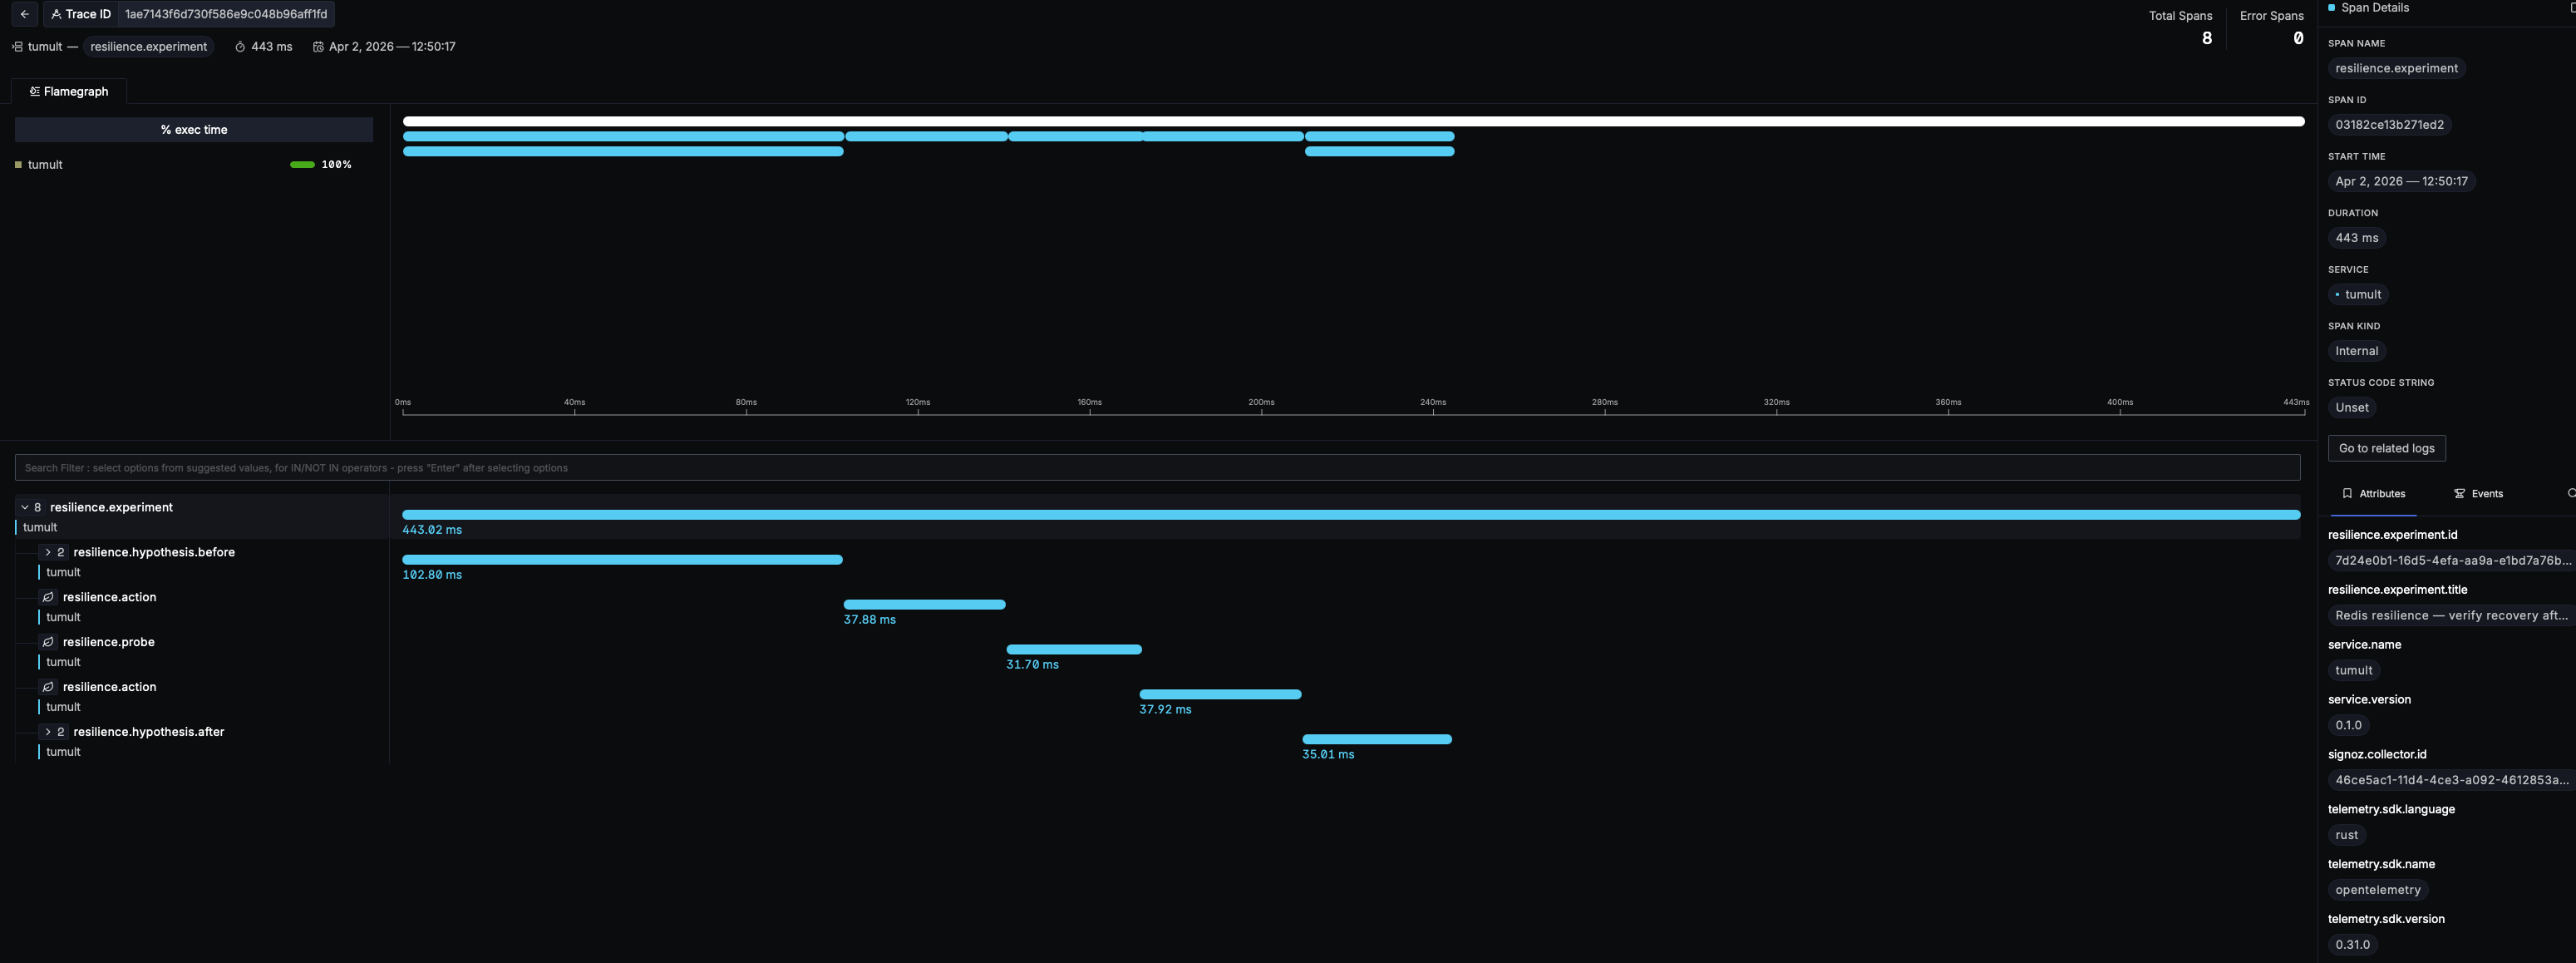
Native Observability
Every experiment produces a full trace — hypothesis, actions, probes, rollbacks — visible in SigNoz, Jaeger, or any OTLP backend. No configuration required.
Ready to Build Resilience?
One command to install. One script to run a full DORA-compliant GameDay.