 The Full Span Waterfall: Tumult Traces in SigNoz

Part 12 of the Tumult series. ← Part 10: Chaos Under Load
In Part 3 of this series, we described the theory: every Tumult experiment is a trace. Every action, probe, and hypothesis evaluation is a span. The fault injection and the system’s response are correlated by trace ID from the moment the experiment starts.
Today we can show you what that looks like in practice.
A Real Experiment, A Real Trace
Here is a Redis resilience experiment running against a live Docker infrastructure. The experiment checks that Redis responds to ping, executes a SET/GET/DEL sequence to verify data operations, and confirms Redis is still healthy afterward.
title: Redis resilience — verify recovery after disruption
description: Check Redis is alive, inject a disruption, confirm it recovers

steady_state_hypothesis:
  title: Redis responds to ping
  probes[1]:
    - name: redis-ping
      activity_type: probe
      provider:
        type: process
        path: sh
        arguments[2]: "-c", "docker exec docker-redis-1 redis-cli ping"
      tolerance:
        type: regex
        pattern: "PONG"
Run it:
OTEL_EXPORTER_OTLP_ENDPOINT=http://localhost:4317 tumult run examples/redis-chaos.toon
Open SigNoz. Navigate to Traces. Click on the tumult service. Here is what you see:
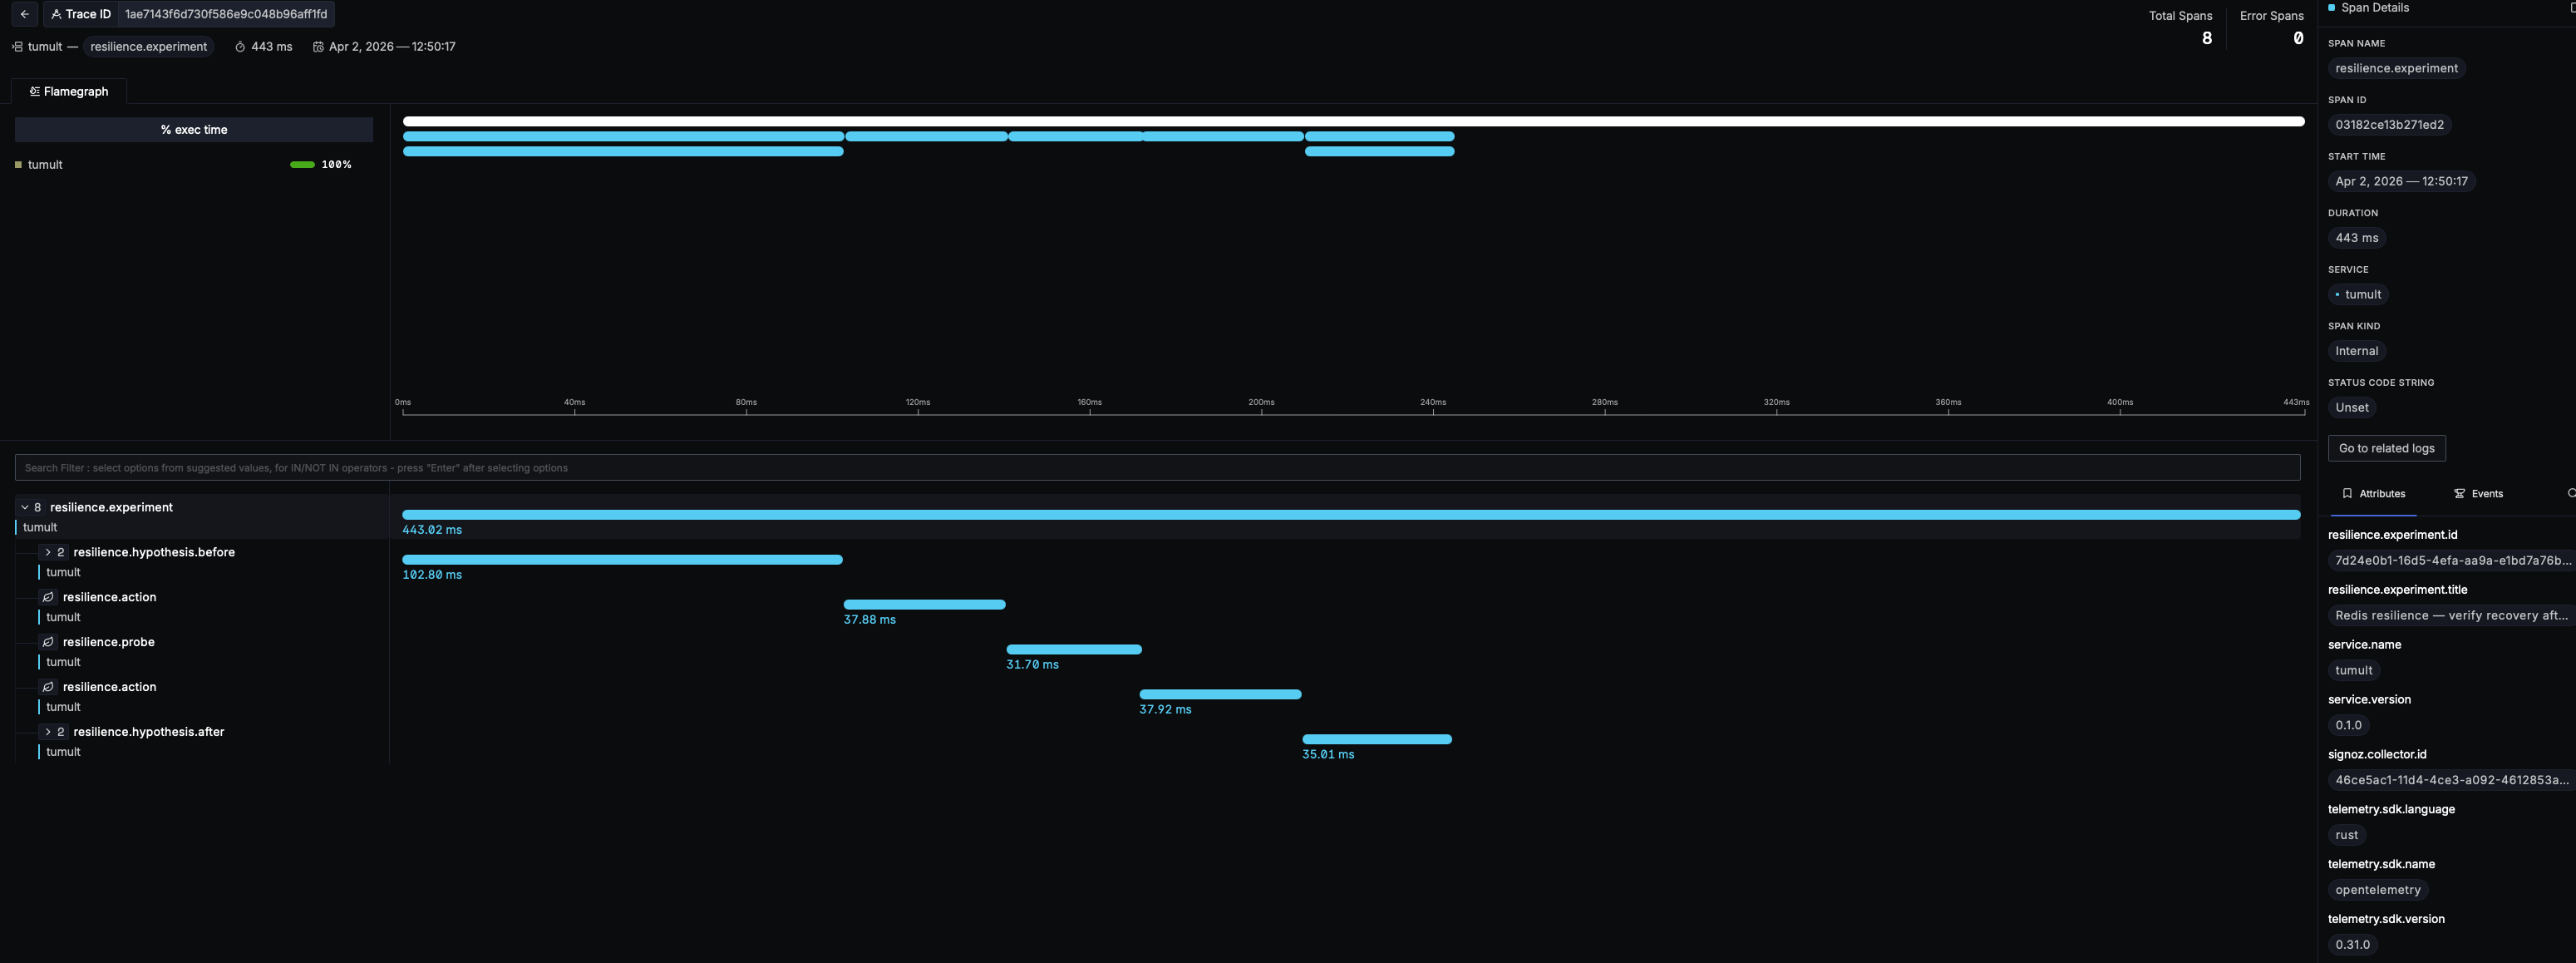
Reading the Waterfall
The trace tells the complete story of the experiment, left to right in time:
resilience.experiment — the root span wrapping the entire lifecycle. It carries the experiment ID, title, and final status. Duration: 443ms.
resilience.hypothesis.before — the steady-state check before fault injection. This is where Tumult verifies the system is healthy before doing anything destructive. Inside it, a resilience.probe runs redis-cli ping and gets PONG.
resilience.action — the chaos method steps. In this experiment, three actions execute sequentially: SET a key, GET the key, DEL the key. Each gets its own span with timing.
resilience.probe — individual probe executions within the method, each timed independently.
resilience.hypothesis.after — the steady-state re-check after the method completes. Same probe, same tolerance. If Redis survived the method, this passes. If it didn’t, the experiment status becomes deviated.
Every span in the waterfall is a real OpenTelemetry span with structured attributes in the resilience.* namespace:
resilience.experiment.id:    41196791-bc81-4f60-83c0-a09fb41d349c
resilience.experiment.title: Redis resilience — verify recovery after disruption
resilience.action.name:      redis-set-key
resilience.activity.type:    Action
resilience.fault.type:       injection
resilience.target.type:      process
service.name:                tumult
service.version:             0.1.0
telemetry.sdk.language:      rust
telemetry.sdk.name:          opentelemetry
What Makes This Different
Most chaos engineering tools generate logs. Some emit metrics. Very few produce traces — and almost none produce traces that span the entire experiment lifecycle with structured attributes on every span.
Here is why that matters.
Timing is precise
The waterfall shows exactly when each phase started and how long it took. The hypothesis-before check took 123ms. The SET action took 37ms. The hypothesis-after took 33ms. These are not log timestamps parsed after the fact — they are span durations measured by the same clock that produced the trace.
Causation is visible
When an experiment deviates, you do not need to grep logs. The span tree shows the exact sequence: hypothesis passed → action executed → hypothesis failed. The action that caused the deviation is a sibling span to the hypothesis that detected it. Causation is a graph relationship, not a log correlation exercise.
Every module participates
The trace does not stop at the experiment runner. When Tumult executes a script plugin, the script.execute span appears as a child of resilience.action. When the journal is ingested into DuckDB, resilience.analytics.ingest appears. When the MCP server dispatches an experiment, mcp.tool.call is the parent span. The entire platform is traced, not just the happy path.
Context propagates to scripts
Every script plugin receives TRACEPARENT and TRACESTATE environment variables — the W3C trace context standard. If your chaos script calls an HTTP service that also participates in distributed tracing, the experiment trace and the service trace are automatically linked. The experiment becomes part of your distributed trace, not a separate silo.
The Pipeline Behind the Screenshot
The trace in the screenshot flows through this pipeline:
Tumult CLI
  → tumult-collector (custom OTel Collector, :14317)
    → SigNoz standalone (all-in-one, :4317)
      → ClickHouse (signoz_index_v3)
        → SigNoz UI (:3301)
The tumult-collector is a purpose-built distribution compiled with the OpenTelemetry Collector Builder. It adds ClickHouse direct export (standard otel_traces schema for DuckDB cross-query), file export (JSONL), Prometheus metrics (host + APM), and span-to-metrics connectors on top of SigNoz’s built-in collector.
The entire infrastructure starts with one command:
docker compose -f docker-compose.yml -f docker-compose.observability.yml up -d
No configuration files to write. No collector pipelines to assemble. The observability stack is pre-wired.
From Trace to Evidence
The same trace data that produces the waterfall in SigNoz also feeds compliance reports:
tumult compliance --framework dora .
=== DORA — Digital Operational Resilience Act (EU 2022/2554) ===

Source: https://eur-lex.europa.eu/eli/reg/2022/2554/oj
Applies to EU financial entities.

Requirements:
  Art. 24 — General requirements for ICT resilience testing
    Testing programme: 47 experiment(s) executed
  Art. 25 — Testing of ICT tools and systems
    Scenario-based tests with documented results
  Art. 11 — Response and recovery
    Recovery procedures tested with measured recovery times

Compliance Status: COMPLIANT
The traces are the evidence. The journal is the audit artifact. The compliance report is generated from the data, not written by hand.
Try It
curl -sSL https://raw.githubusercontent.com/mwigge/tumult/main/install.sh | sh
tumult run examples/redis-chaos.toon
The trace is automatic. Open SigNoz at http://localhost:3301, navigate to Traces, find tumult. The waterfall is waiting.
Try Tumult at tumult.rs
Next in the series: Part 13 — Load During Chaos →